Stock Market Weekly Update: Rallies to Order
Stock-Markets / US Stock Markets Nov 18, 2007 - 03:41 PM GMTBy: Dominick
 Members and regular readers will find an important message about the future of TTC at the bottom of this update, but for now, let's simply recall a statement from last week: Now, just as some big names are calling this the end of the bull market, we're willing to go it alone and say this is probably closer to the end of the selling than the beginning, and, if that assessment is correct, we'll be seeing the market turn soon and rally hard, quite likely taking us to new highs.
So it's clearly not just empty bragging to say we anticipated and were long for the huge rally this past Tuesday. Obviously we're nowhere near new highs yet, so going into the holiday week and the year end in general we're expecting more potential upside. Friday's close, however, conveniently left it undecided whether there's still one more quick low first or if a low is now in place. Of course, we aren't biased to either outcome and members have the important levels that will decide the trade for us.
Essentially, the markets have been trading in a range since June and this has been bad news for the buy and hold crowd, but paradise for traders. Monday started off the week in typical fashion, and we continued trading our proprietary target levels with an eye for a support level the markets could use to ramp up.
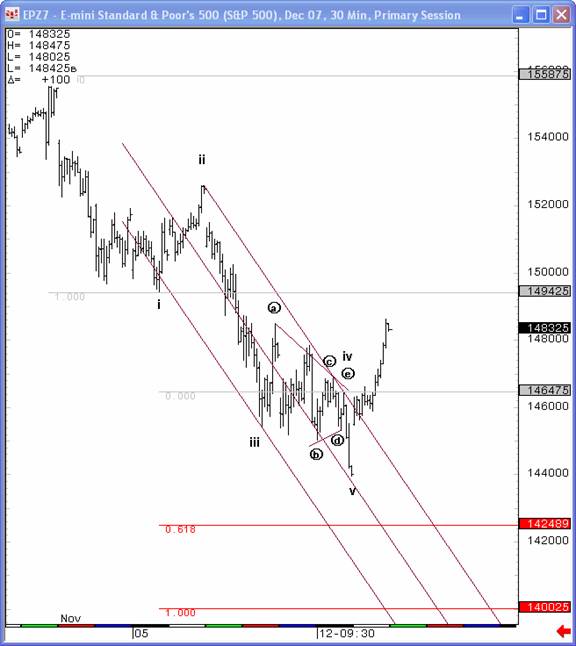
The crucial support for the triangular pattern unfolding between two of our key levels was the 1457.50 described in previous updates. When it broke Monday, we shifted our expectations to an alternative, pictured in the chart below, which, conveniently, was on our radar as a possibility from last week. As the selling accelerated into the close, I told members that I'd be getting long the Nasdaq and holding it through Christmas. Though, this was somewhat tongue-in-cheek, our unique blend of Elliott wave and proprietary indicators was giving us a clear signal to begin attempting trades to the long side.

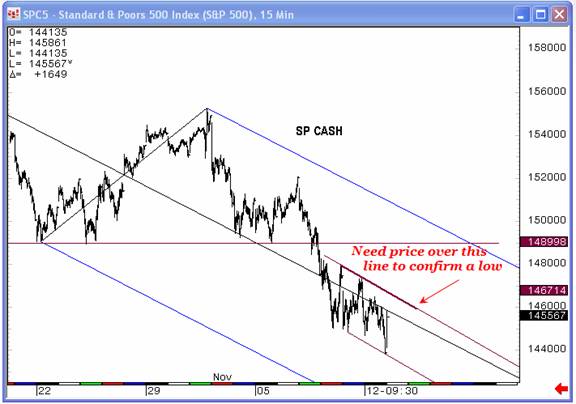
Those that took the trade were rewarded with a gap up opening on Tuesday, as if on demand, which happened to come in the vicinity of 1457.50. As this sort of confirmation has been occurring repeatedly lately, by now members know how to manage their positions as the market reacts to the number. To be honest, the market could have gapped either way, but based on the count above we believed strongly at the close on Monday we were finally in the vicinity of at least a short term bottom. As the Tuesday morning opening hit the tape, the following chart served to emphasize that, though we were still expecting further upside action, the fickle nature of the market required confirmation before simply swinging for the fences.

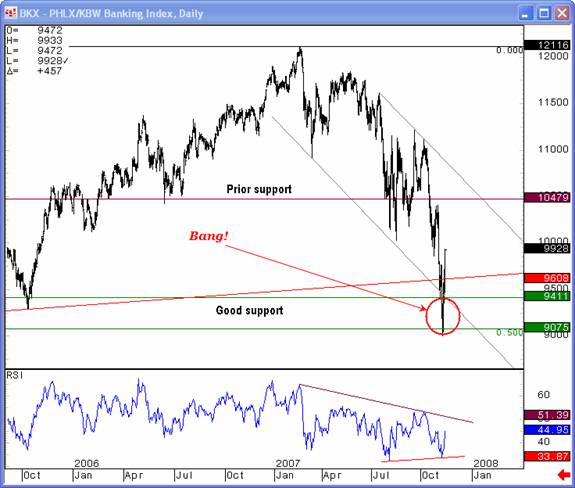
The opening held and never retreated. Even members that woke up after lunch and waited for confirmation made 20 points. The chart below shows the BKX finding the support that we have mentioned for the past two weeks as the fuel that would spark a huge rally in the S&P.

After Tuesday's huge rally, it would be hard to blame anyone for taking some profits, and that was probably the smart thing to do, but based on our outlook, there was no reason at all to get out of long positions. After all, I had joked about staying through Christmas!
Wednesday continued the rally with another big gap up, but the fact that it came in exactly at an old resistance level was highly suspect. The market couldn't hold the gap and, after some 50 points of profit, that was a signal to really start trimming longs if not getting flat altogether. From an Elliott wave perspective, the move clearly looked like an impulsive 3 rd wave, so a retracement before new highs seemed highly likely.
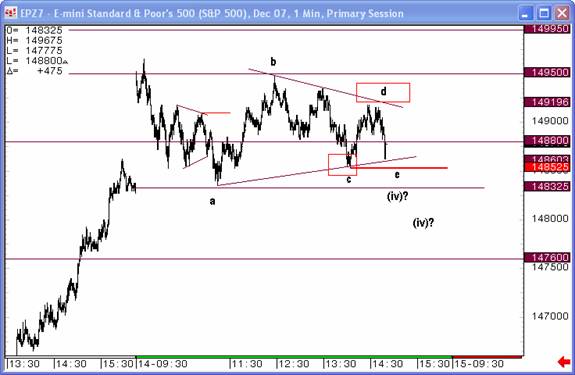
As the day unfolded, another triangle began to appear in the S&P, but it didn't take long before it became one of our "triangle trap" setups that would break to the downside . A triangle has clear targets, so, provided you don't jump the gun but wait for confirmation, it's not too difficult to avoid the traps or get in on the fast breakdown. The chart below shows the progress of our tracking Wednesday afternoon, with the breakdown labeled as a distinct possibility. As the trap indeed materialized and triangle broke down, support came in at our tried and true 1476 level .

All bets were off, at least in terms of counting the pattern, as we lost the triangle. Fourth waves have a wide range of potential targets and are often used to get as many people on the wrong side of the trade as possible. Keeping this in mind, we fell back to our proprietary indicators and targets to navigate a volatile Friday that saw almost 60 points in total mileage on a twenty point range, all the while looking for the support level that, like Monday, would provide the basis for a new ramp upward.
That support level did come in and launch a rally Friday afternoon, but, as mentioned at the start of this update, we don't yet have the confirmation necessary to say a bottom is in place. We'll know soon enough, though, which way the market decides and continue our trading accordingly. We're still standing by our call from last week and don't yet believe the market is done serving up rallies. Are you having it your way?
A Look at the Future of TTC
As TTC approaches the close of its second year in operation, plenty of fond memories come to mind, of selling tops, of buying bottoms, but also of working and trading alongside the members, day to day and week to week. On the whole, this site continues to be a labor of love for me, the most satisfying aspect being the community of traders that find a valuable resource in the give and take that happens here.
As you might know, over the past year we've upgraded our server and expanded our trend cycle charts page, which now includes euro, gold, oil, and market indicators. Provided it doesn't make the site slower, I'll be looking to add even more trend cycle charts next year. In fact, looking forward, there're several changes that are probably going to have to take place to increase the value of the site for the members, and most importantly, to foster our growing sense of community.
It was along these same lines that we saw a modest price increase last July that had new members registering at $89 with existing members being grandfathered in at the original $50 monthly price. I've wrestled with this decision, but it's become clear there will have to be another price increase, effective on or about February 1, 2008 . At that time, ALL existing members will pay $89 per month with new registers signing up for $129.
The vast majority of members have expressed they have no difficulty making back the monthly fee and that the value of the site far exceeds the cost. But, if you are one who resents the increase, there's a larger goal and another big change motivating the hike that may convince you to stay.
As I mentioned, the sense of camaraderie and community in the chatroom and forums is something I'd like to continue developing in this site and, to do that, I've decided to take the bold move of closing the doors to new members at some undefined point next year. This will give us a chance to get better at working together as a team instead of dealing with a constant revolving door of new members. It will also free up my time and the moderators' time to get into more detail about individual setups and getting to know fellow traders. Since there would also be less threat of my charts being leaked to other sites and diluting the analysis by getting too many people trading it, this would allow me to post more alternative patterns and more forward-looking projections.
So, essentially, I've decided to offer a better service to fewer members than providing mediocre service and trying to make up the difference on volume. The February fee hike and closing the doors will help make that possible. As we phase into this new era, I will always maintain access for institutional traders and referrals from existing members, and may, from time to time, reopen for new retail members if there is attrition in our ranks. But I hope TTC will be the group you stick with for the rest of your trading career, and to facilitate this, I've also configured Paypal so members can pay in advance for 3, 6, or 12 months at a discount to the regular month-to-month fee. In addition to saving you money, this should simplify your paperwork and mine.
It's been a lot of fun sharing my work and exchanging ideas over the past two years. Now it's approaching time again for our end of the year contests, and soon we will kick off our annual “Pick the Tick” contests, with special prizes for the closest pick to the closing price for the year on the Dow, S&P and Nasdaq. Stay tuned to Market Update for more information on this opportunity.
So that's it, a look into the future near and far for TTC. It's been quite a ride so far and as you can see it's only going to get better from here. I hope you stay with us. Thanks for reading and see you in the forums!
Don't forget to Join now for only $89 a month!
Have a profitable and safe week trading, and remember:
“Unbiased Elliott Wave works!”
By Dominick
www.tradingthecharts.com
If you've enjoyed this article, signup for Market Updates , our monthly newsletter, and, for more immediate analysis and market reaction, view my work and the charts exchanged between our seasoned traders in TradingtheCharts forum . Continued success has inspired expansion of the “open access to non subscribers” forums, and our Market Advisory members and I have agreed to post our work in these forums periodically. Explore services from Wall Street's best, including Jim Curry, Tim Ords, Glen Neely, Richard Rhodes, Andre Gratian, Bob Carver, Eric Hadik, Chartsedge, Elliott today, Stock Barometer, Harry Boxer, Mike Paulenoff and others. Try them all, subscribe to the ones that suit your style, and accelerate your trading profits! These forums are on the top of the homepage at Trading the Charts. Market analysts are always welcome to contribute to the Forum or newsletter. Email me @ Dominick@tradingthecharts.com if you have any interest.
This update is provided as general information and is not an investment recommendation. TTC accepts no liability whatsoever for any losses resulting from action taken based on the contents of its charts, commentaries, or price data. Securities and commodities markets involve inherent risk and not all positions are suitable for each individual. Check with your licensed financial advisor or broker prior to taking any action.
Dominick Archive |
© 2005-2022 http://www.MarketOracle.co.uk - The Market Oracle is a FREE Daily Financial Markets Analysis & Forecasting online publication.


