


Jump in U.S. Payroll Employment Stands Out
Economics / Employment May 07, 2011 - 07:41 AM GMTBy: Asha_Bangalore

 Civilian Unemployment Rate: 9.0% in April vs. 8.8% in March. Cycle high for recession is 10.1% in October 2009.
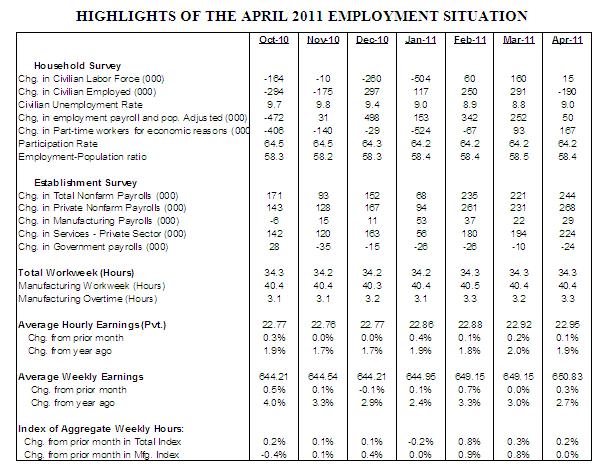
Payroll Employment: +244,000 in April vs. +221,000 in March. Private sector jobs increased 268,000 after a gain of 231,000 in March. Revisions for February and March and February resulted in a net gain of 46,000 jobs in the economy.
Private Sector Hourly Earnings: $22.95 in April vs. $22.92 in March; 1.9% yoy increase in April vs. 2.0% gain in March.
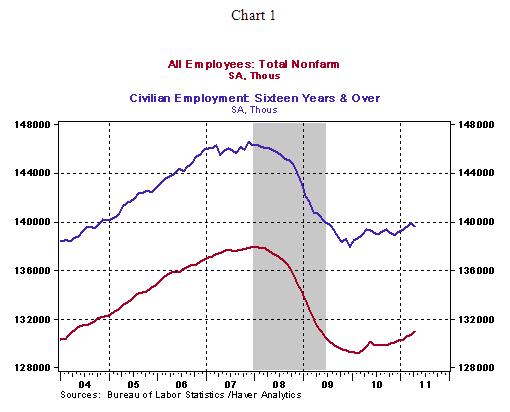
Payroll employment increased 244,000 in April and the civilian unemployment rose slightly to 9.0% from 8.8% in March. These headlines are somewhat confusing. The best way to reconcile these contrary indications is by examining the trend of total employment over a longer duration rather than drawing conclusions from one month's data. The headlines numbers are from two different surveys of the Bureau of Labor Statistics. The civilian unemployment rate is derived from the household survey and the payroll employment is obtained from the establishment survey. Employment numbers from both surveys show that overall employment is moving up since the recession ended, despite the decline in employment during April based on the household survey (see Chart 1).
 It is also interesting to note that although the civilian unemployment rate declined in the November - April period (9.8%-9.0%), the increase in employment during this period under the household survey (+750,000) is less than the change recorded by payroll employment (+920,000) as obtained from the establishment survey. The conclusion is the headlines in April are puzzling but when underlying data are examined over a period of time, the message is comparable. Also, it is important to note that payroll employment is a coincident indicator and the unemployment is a lagging indicator.
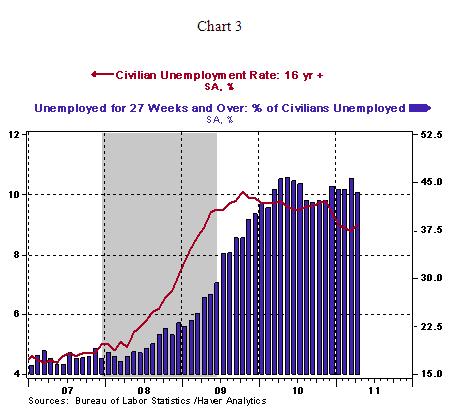
 Household Survey - Moving on to the details of the household survey, the increase in the unemployment rate is the first gain since November. It should not be surprising to see additional hikes because the labor force of the nation has either declined or posted tepid gains since September 2010. As the economy and the labor force expand, the gain in the labor force could be larger than the increase in employment. As noted earlier, month-to-month movements in the unemployment rate at turning points should be viewed with caution, while change over a longer span is a better indicator of underlying fundamentals. The April report shows a drop in the percentage of people unemployed for over six months to 43.4% from 45.5% in March, which is a big plus.
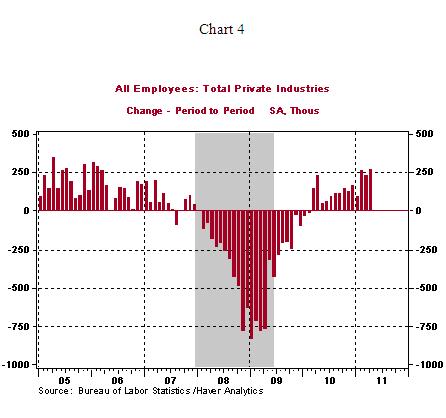
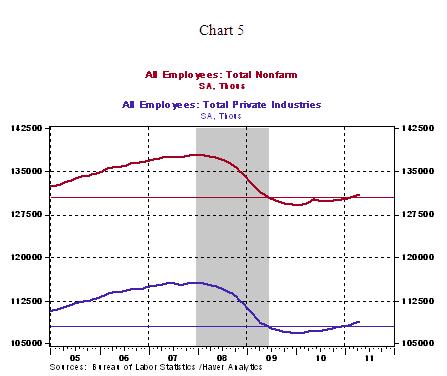
Establishment Survey - Total payrolls rose 244,000 in April, after an increase of 221,000 in February. Private sector employment has risen at an impressive clip in the February-April months, with gains of 261,000, 231,000, and 268,000 in each of these months, respectively (see Chart 4). In addition, the level of employment (total and private sector) has registered a visible jump that exceeds the level of employment recorded at the end of the recession in June 2009 (see Chart 5)
 Highlights of changes in payrolls during April 2011:
Construction: +5,000 vs. +2,000 in March
Manufacturing: +29,000 vs. +22,000 in March
Private sector service employment: +268,000 vs. +231,000 in March
Retail employment: +57,000 vs. -3,000 in March
Professional and business services: +51,000 vs. +86,000 in March
Temporary help: -2,300 vs. +34,400 in March
Financial activities: +4,000 vs. +5,000 in March
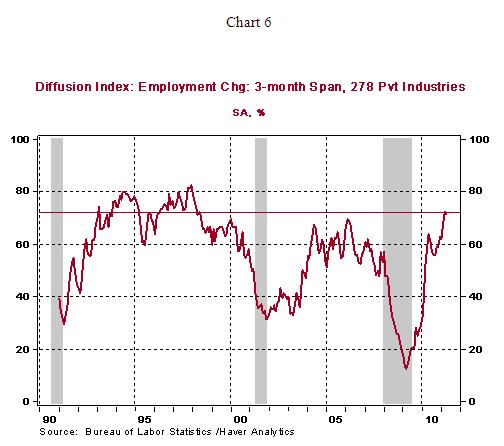
The diffusion index in the March-April period (72%) is the highest in thirteen years (see Chart 6) and it is indicative of the widespread increase in hiring in the last two months.
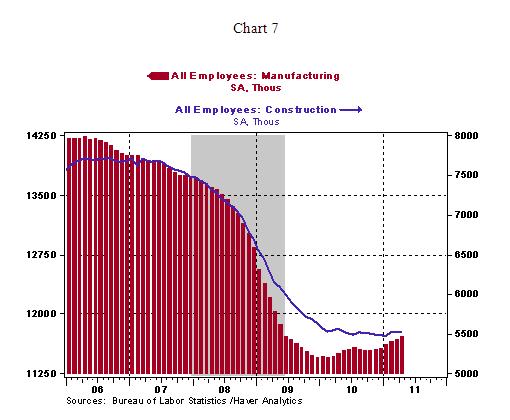
 Factory employment has risen around 250,000 since December 2009, the recent cycle low. Construction employment has failed to make a mark since early 2010 (see Chart 7).
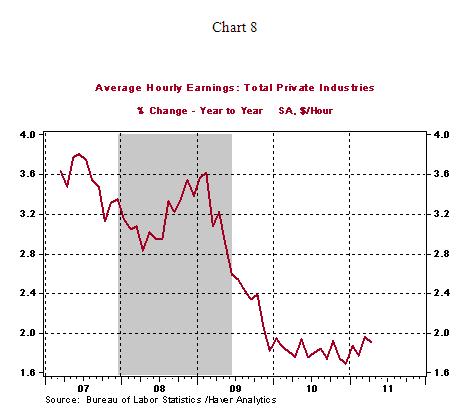
Hourly earnings continue to show muted gains (1.9% year-to-year change) and do not present an inflationary threat. The 0.3% increase in weekly earnings ($650.83) and strong increase in payrolls point to a noticeable jump in personal income in April. The steady reading of the manufacturing man-hours index does not bode positively for industrial production. Auto plant shutdown due to supply issues related to the tsunami in Japan could be a factor holding down overall factory activity in April.
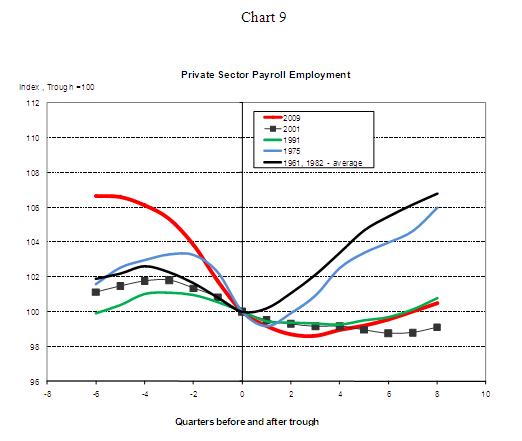
Conclusion - The widespread increase in payrolls during April is noteworthy but the extent of job losses during the recession leaves more to be desired after seven quarters of economic growth. Private sector employment gains, after 22 months of economic recovery/expansion, is tepid compared with the pace of hiring seen in the recoveries following recessions in the 1960-1982 period ( Chart 9 is an index chart where the level of employment at the trough of each recession is set equal to 100. An index reading of 105.0 implies a 5.0% increase in employment from the trough, while an index level of 96.0 is a 4.0% drop in employment from the trough. The level of employment in April is the proxy for employment in 2011:Q2). The less than 1.0% increase in private sector employment after eight quarters is woefully below the 6.8% gain seen after the 1961 and 1982 recessions. This soft improvement in hiring combined with a sluggish housing market and fiscal stress of state and local governments justifies the Fed's concern and dissatisfaction with the fundamentals of the economy after the extraordinary financial accommodation put in place. The fragility of recovery suggests that the Fed is on hold for an extended period after the $600 billion purchase program of the Treasuries expires in June 2011.
Asha Bangalore — Senior Vice President and Economist
http://www.northerntrust.com
Asha Bangalore is Vice President and Economist at The Northern Trust Company, Chicago. Prior to joining the bank in 1994, she was Consultant to savings and loan institutions and commercial banks at Financial & Economic Strategies Corporation, Chicago.
Copyright © 2011 Asha Bangalore
The opinions expressed herein are those of the author and do not necessarily represent the views of The Northern Trust Company. The Northern Trust Company does not warrant the accuracy or completeness of information contained herein, such information is subject to change and is not intended to influence your investment decisions.
© 2005-2022 http://www.MarketOracle.co.uk - The Market Oracle is a FREE Daily Financial Markets Analysis & Forecasting online publication.