


Coal Use Shine’s Light on China's Economic Growth
Commodities / Coal May 03, 2011 - 04:09 AM GMTBy: Frank_Holmes

 International coal prices hit $124 per ton this week, the highest levels in five months, as strong demand from reconstruction projects in Japan and reduced supply from flood-ravaged Australia has made coal supply tight. The floods in Queensland, Australia cut the country’s output of coal by 15 percent and other big coal producers such as Indonesia, South Africa and Colombia are experiencing similar production cuts due to floods of their own.
 At the end of March 31, coal prices were 33 percent higher than a year ago and earlier this month, mining giant Xstrata inked a one-year deal with a Japanese utility at $130 per ton, effectively setting a floor under coal prices in the near-term. That’s up from $98 per ton the company made in a similar deal a year ago.
Perhaps no country is more affected by this development than China. With its economy powering ahead with 9.7 percent GDP growth during the first quarter, Chinese electricity use was up 13.4 percent on a year-over-year basis over the same time period, according to China’s National Energy Association (NEA). China’s overall electricity consumption is now expected to rise 12 percent this year, up from the 9 percent growth the NEA forecasted in January.
China’s Electricity Council said the country may face power shortages of 30 million kilowatts during the summer so the government has moved quickly to put restrictions in place as the peak season approaches. Big industrial provinces such as Guangdong and Zhejiang are already scaling back power consumption. These reductions are likely to hinder aluminum, cement, zinc and steel output, according to Macquarie Commodities Research.
 In addition, the National Development and Reform Commission (NRDC) called a meeting this week of domestic coal suppliers such as Shenhua Energy and China Coal Energy to ensure stable supplies, the China Daily said.
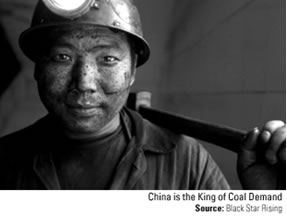
Coal powers the Chinese economy. The country is the world’s largest consumer, gobbling up nearly half of the world’s coal consumption in 2009. Coal accounted for 71 percent of China’s energy in 2008—more than three times the United States’ share. The Electricity Council estimates that the country’s coal demand will reach 1.92 billion tons in 2011, up nearly 10 percent from 2010.
China hasn’t always been such a glutton for coal. In fact, coal consumption actually declined from 1996 to 2000. However, consumption has shot up 180 percent since then and China accounted for 80 percent of demand growth between 1990 and 2010, according to BP.
This is because demand for electricity exploded over that time. China’s rapid urbanization and rising middle class has led to an exponential number of new refrigerators, air conditioners and other appliances in homes.
Despite the rise in incomes and increased consumer demand, China’s electric power consumption remains relatively low. You can see from the chart on the right that the U.S. consumes roughly four times the amount of electricity per capita than China. The world’s second-largest economy even trails Greece, Poland and Hungary.
Luckily for China, it sits atop the third-largest amount of recoverable coal reserves in the world behind the U.S. and Russia. The country ramped up its coal production from 645.9 million tons of oil equivalent in 1999 to 1,552.9 million tons in 2009. Despite this increase, production couldn’t keep up and the country became a net importer of coal in 2009. Production jumped over 15 percent during 2010 but the country was still forced to increase coal imports by 42 percent in order to meet demand, according to the China Daily.
 There are two types of coal. Thermal coal is burned in furnaces to create electricity and metallurgical coal, also called coking coal, is used to create concrete and steel. China’s coal reserves are light on the latter, which has required China to rely on countries such as Australia, Indonesia and Russia for supply.
These imports are playing a vital role in China’s infrastructure boom. The U.S. Energy Information Administration (EIA) estimates that Australia’s total exports to Asia, which also includes Japan and India, will increase 64 percent to 394 million tons by 2035. This accounts for 94 percent of Australia’s total exports.
Coal exports from Indonesia, Asia’s second-largest source of coal, are expected to rise 26 percent over the same time period, according to the EIA. In 2009, China signed a 25-year, $6 billion loan-for-coal agreement with Russia that will supply the country with 15-20 million tons of coal.
The Chinese government made it clear that it wants to wean the country’s power grid from coal. That’s proven to be a difficult task. China’s 12th Five Year Plan calls for big improvements in energy efficiency and the development of additional sources including natural gas.
Massive projects such as the Three Gorges Dam have sought to increase capacity of alternatives, but hydroelectric, nuclear and other renewables combined make up only 10 percent of total power. In addition, low water levels due to a drought in Southern China have reduced current hydroelectric capacity.
The ongoing disaster at the Fukushima nuclear plant in Japan has delayed but not squashed China’s nuclear ambitions. The country has plans to build more than two dozen plants by 2020, accounting for 40 percent of new nuclear facilities around the globe.
Only time will tell if the effort will be successful. The EIA forecasts that China’s power generation from coal will increase by 2035 but will only account for 62 percent of total power generation at that time. However, the EIA says that absolute coal consumption will nearly double as the economy continues to grow and electricity demand remains strong.
With coal’s short- and long-term status atop China’s energy mix intact, we think some domestic coal producers stand to benefit. To participate, we’ve taken positions in several coal producers including Shenhua Energy and Yanzhou Coal which we believe offer tremendous potential for the China Region Fund (USCOX).
Michael Ding and Xian Liang, analysts for the China Region Fund (USCOX), contributed to this commentary. For more updates on global investing from Frank and the rest of the U.S. Global Investors team, follow us on Twitter at www.twitter.com/USFunds or like us on Facebook at www.facebook.com/USFunds. You can also watch exclusive videos on what our research overseas has turned up on our YouTube channel at www.youtube.com/USFunds.
Please consider carefully the fund's investment objectives, risks, charges and expenses. For this and other important information, obtain a fund prospectus by visiting www.usfunds.com or by calling 1-800-US-FUNDS (1-800-873-8637). Read it carefully before investing. Distributed by U.S. Global Brokerage, Inc.
Standard deviation is a measure of the dispersion of a set of data from its mean. The more spread apart the data, the higher the deviation. Standard deviation is also known as historical volatility. All opinions expressed and data provided are subject to change without notice. Some of these opinions may not be appropriate to every investor. The S&P 500 Stock Index is a widely recognized capitalization-weighted index of 500 common stock prices in U.S. companies. The NYSE Arca Gold BUGS (Basket of Unhedged Gold Stocks) Index (HUI) is a modified equal dollar weighted index of companies involved in gold mining. The HUI Index was designed to provide significant exposure to near term movements in gold prices by including companies that do not hedge their gold production beyond 1.5 years. The MSCI Emerging Markets Index is a free float-adjusted market capitalization index that is designed to measure equity market performance in the global emerging markets. The U.S. Trade Weighted Dollar Index provides a general indication of the international value of the U.S. dollar.
Frank Holmes Archive |
© 2005-2022 http://www.MarketOracle.co.uk - The Market Oracle is a FREE Daily Financial Markets Analysis & Forecasting online publication.