


Stock Market Weekly Update: Trading by Numbers
Stock-Markets / US Stock Markets Nov 11, 2007 - 02:46 PM GMTBy: Dominick
 It was nice to see more of our membership coming in tune with the rhythm of Wall Street this week rather than always being stuck a move behind. The gems in the Nasdaq finally turned into trash this week and, with the help of the financials, had the whole market trading lower. We don't tend to buy high-flyers or sell into holes, but this week really had most Ellioticians scratching their heads.
Now, just as some big names are calling this the end of the bull market, we're willing to go it alone and say this is probably closer to the end of the selling than the beginning, and, if that assessment is correct, we'll be seeing the market turn soon and rally hard, quite likely taking us to new highs.
Don't mistake this outlook as a bias, though –we have levels that need to be reached to get us into the trade and will get us out if wrong. It's just that we've had this decline as one of our possible patterns off the July highs and as we reach the target, there's enough evidence in the charts to keep alive the likelihood of a reversal. And if we do get that rally, don't forget where you heard it first!
But in the meantime, until we have confirmation, we're going to continue trading our numbers as we've done for the past several weeks. The last update outlined several key numbers and how they've been respected by the markets. The chart below, posted Wednesday morning, shows how our numbers, represented by the red lines, continued to unfold in the S&P futures.
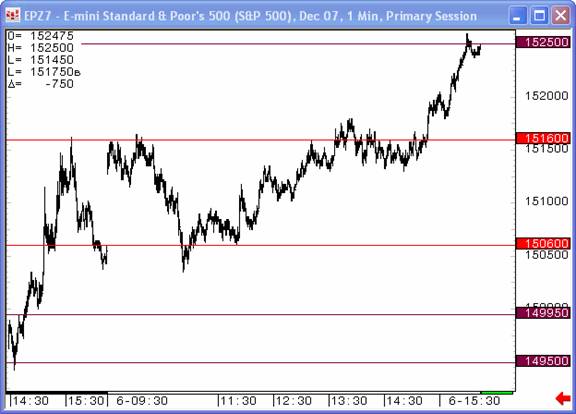
As you can see, Monday's rally peaked at 1516, one of our levels, but sold off to end the day at 1506, another target area. Tuesday's strong open brought us to a double top, again at 1516, and 1506 served as crucial support later in the day before rallying again to the 1516 level. Once 1516 was decisively taken out, our next target was 1525, which was met and retested at the close. Our tried and true method for keeping profits, TMAR (take the money and run) resounded in the forums and chatroom at that point as active traders were sitting on nearly 20 points of profit. Seeing gold, oil, and the euro all making new highs, which clearly did not bode well for stocks, helped reinforce this decision to sell at our target number into the close.
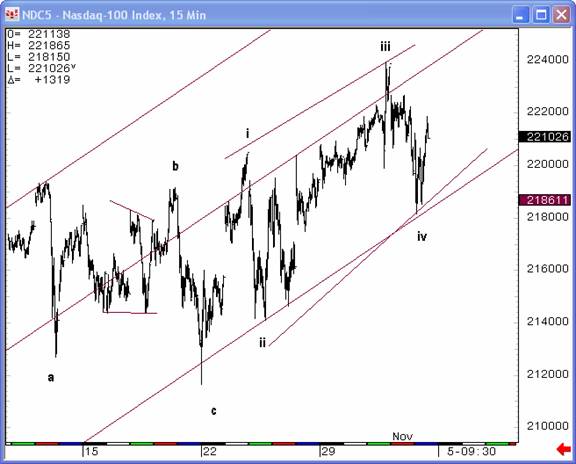
And the profit-keeping technique, which was described and emphasized in last week's update, proved its worth yet again as we woke Wednesday morning to a large gap down. The Nasdaq chart below was included in last week's update and was part of our suspicion that there would be opportunity to play the long side this week, with an eye focused to its terminal pattern.
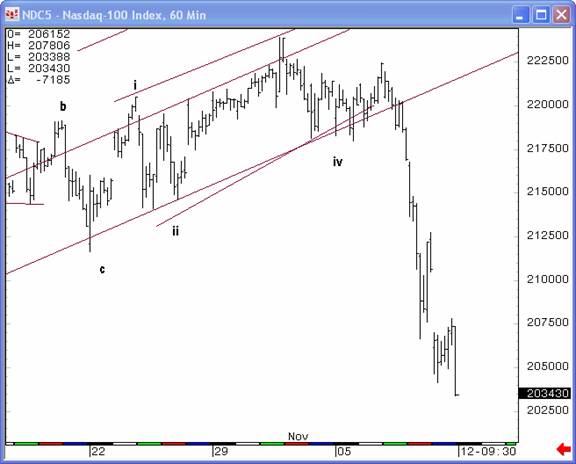
Well, as you probably know, the tech high-flyers like GOOG, RIMM, AAPL, BIDU, all took a beating late in the week and brought the index to its knees, probably truncating the pattern. This was a scenario we'd contemplated a few weeks before when we examined a 1987 analog and studied the divergence between the Nasdaq and S&P during that period. Essentially, we knew they'd have to come together either through selling in tech or a rally in the S&P. The chart below shows how the NDX futures finished the week.
Clearly the Nasdaq had gotten ahead of itself and those who wanted to party like it was 1999 found themselves scrambling to dump the darlings that were simply must-own stocks a few days and weeks before. But so it goes in a fickle market.
Seeing tech stocks taking the brunt of the selling, and being flat from our profit-taking the day before, we were able to adjust our approach to the market and use our numbers to trade to the downside. The gap put us at 1516, no less, and losing this level decisively got us bearish and gave us an ultimate target of 1455, though we monitored the action at other key levels, like 1506, to reevaluate our position. As it worked out, the low for the week was 1454, one point below our target number.
Those waiting to get long had simply to wait on the sidelines for 1455 and ride the 30 point end of day rally that ensued off that low. You better believe we pulled a TMAR after that one!
So, as you can see, our unbiased approach allowed us to trade both sides of the market this week, using our proprietary targets to paint the market for us.
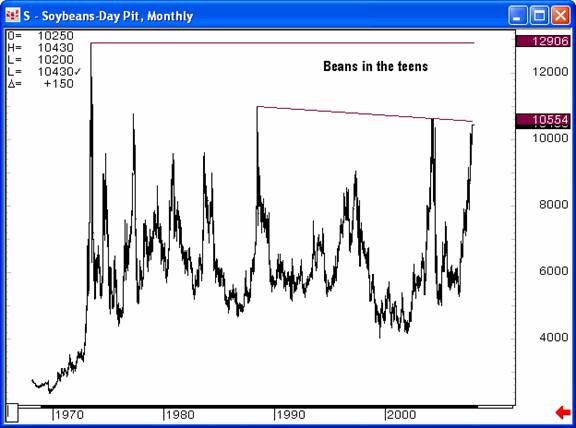
It might be time to watch commodities such as soybeans, which like gold and oil and the euro, have been ramping on the weakening dollar. An old saying has always been “Beans in the teens”, and as we see in the chart below, they are now in the teens from a recent low of 5.00. Do beans find good resistance at this trendline or do they explode to 13? We are about to find out real soon!!
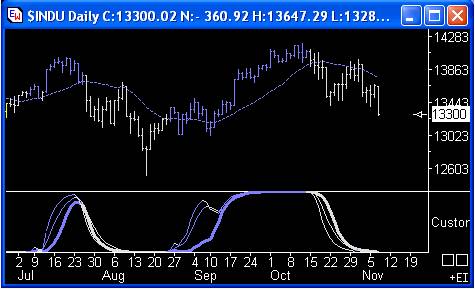
And, we have numerous tools that compliment each other or sometimes take the
lead in times when other methods are fuzzy. Members that solely use these trend charts for swing trades might just be bored from making easy money as they received their stress free signal at the top and are now are waiting for a smaller time frame to hint that this daily chart might flip back up.
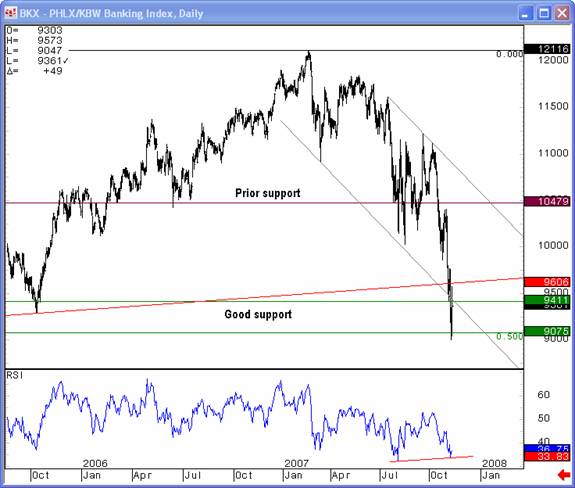
Strict Elliott wave would lean towards a new low next week, but as I've already stated, we believe this decline could be ending very soon. As TTC member and contributor Vince Foster wrote in last weeks update for members only, the banking index could be a major tell for the direction of the next move. And, as you can see from this final chart, it's already reacted to a strong support area and could be putting in a short term bottom. If so, make sure you've been nice, because a Santa Claus rally will be coming to town. See you next week!
Don't forget to Join now for only $89 a month!
Have a profitable and safe week trading, and remember:
“Unbiased Elliott Wave works!”
By Dominick
www.tradingthecharts.com
If you've enjoyed this article, signup for Market Updates , our monthly newsletter, and, for more immediate analysis and market reaction, view my work and the charts exchanged between our seasoned traders in TradingtheCharts forum . Continued success has inspired expansion of the “open access to non subscribers” forums, and our Market Advisory members and I have agreed to post our work in these forums periodically. Explore services from Wall Street's best, including Jim Curry, Tim Ords, Glen Neely, Richard Rhodes, Andre Gratian, Bob Carver, Eric Hadik, Chartsedge, Elliott today, Stock Barometer, Harry Boxer, Mike Paulenoff and others. Try them all, subscribe to the ones that suit your style, and accelerate your trading profits! These forums are on the top of the homepage at Trading the Charts. Market analysts are always welcome to contribute to the Forum or newsletter. Email me @ Dominick@tradingthecharts.com if you have any interest.
This update is provided as general information and is not an investment recommendation. TTC accepts no liability whatsoever for any losses resulting from action taken based on the contents of its charts, commentaries, or price data. Securities and commodities markets involve inherent risk and not all positions are suitable for each individual. Check with your licensed financial advisor or broker prior to taking any action.
Dominick Archive |
© 2005-2022 http://www.MarketOracle.co.uk - The Market Oracle is a FREE Daily Financial Markets Analysis & Forecasting online publication.