U.S. March Employment Situation, Fed Remains on Track to Complete QE2
Economics / Employment Apr 02, 2011 - 05:47 AM GMTBy: Asha_Bangalore

 March Employment Situation – Although Private Sector Payroll Growth is Impressive, Fed is on Track to Complete QE
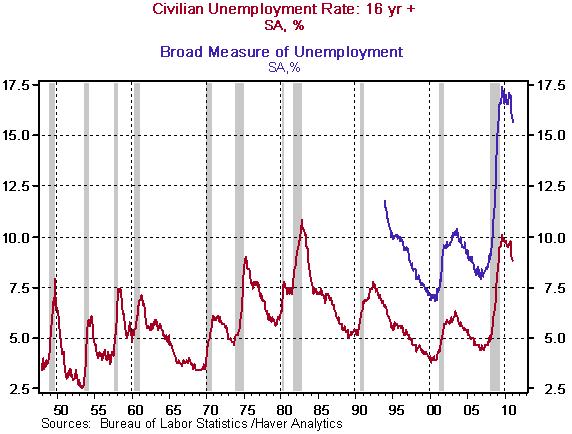
Civilian Unemployment Rate: 8.8% in March vs. 8.9% in February. Cycle high for recession is 10.1% in October 2009.
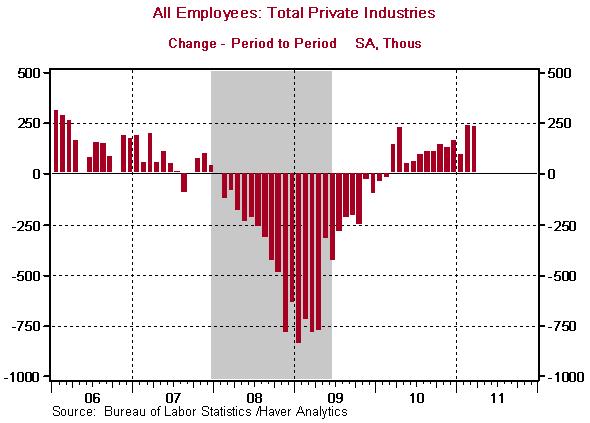
Payroll Employment: +216,000 in March vs. +194,000 in February. Private sector jobs increased 230,000 after a gain of 240,000 in February. Revisions for January and Februay resulted in a net gain of 7,000 jobs in the economy.
Private Sector Hourly Earnings: $22.87 in March, unchanged from February; 1.7% yoy increase in March vs. a similar gain in February.
HIGHLIGHTS OF THE MARCH 2011 EMPLOYMENT SITUATION
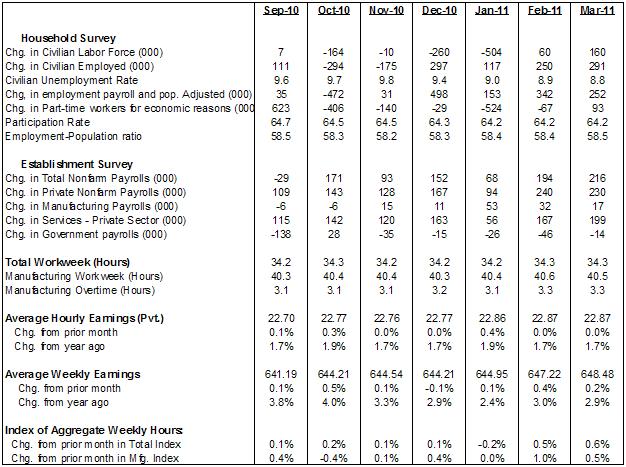
Household Survey – The civilian unemployment rate edged down to 8.8% in March from 8.9% in the previous month. The unemployment rate has declined one percentage point since November 2010. The broad measure of unemployment declined to 15.7% from 17.0% in November 2010. The participation rate was unchanged in March at 64.2%. The employment-population ratio recorded a small gain in March (58.5% vs. 58.4% in February).
Chart 1
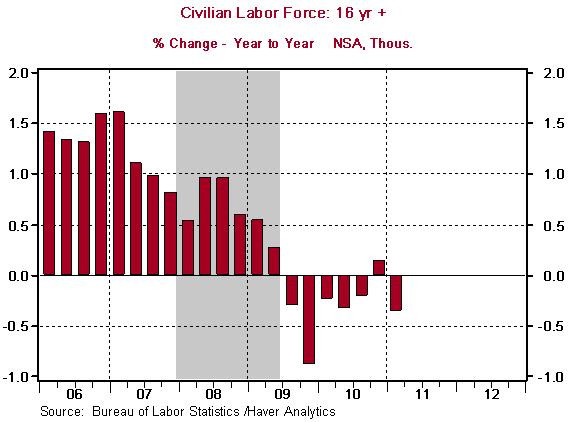
The labor force has posted gains in February (+60,000) and March (+160,000) after a string of four monthly declines. But, in the seven quarter span of economic recovery, the labor force has increased during only one quarter on a year-to-year basis (see chart below).
Chart 2
Establishment Survey – Payroll employment increased 216,000 in March after a gain of 194,000 in the prior month. Private sector employment grew 230,000 in March after advancing 240,000 in the prior month, the strongest back-to-back monthly increases in five years (see Chart 3).
Chart 3
Highlights of changes in payrolls during March 2011:
Construction: -1,000 vs. +37,000 in February
Manufacturing: +17,000 vs. +32,000 in February
Private sector service employment: +199,000 vs. +167,000 in February
Retail employment: +18,000 vs. -8,000 in February
Professional and business services: +78,000 vs. +44,000 in February
Temporary help: +28,800 vs. +22.700 in February
Financial activities: +6,000 vs. -3,000 in February
Health care employment: +36,600 vs. +32,600 in February
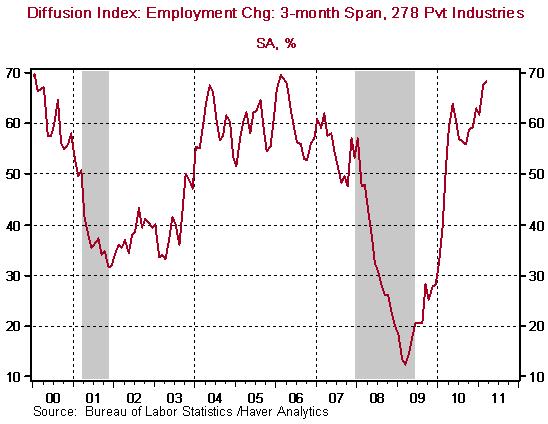
The 3-month diffusion index of private sector employment underscores the widespread increase in hiring (see Chart 4). At 68.2%, the latest diffusion index of payrolls is the highest in five years. Government payrolls fell 14,000 in March after a loss of 46,000 jobs in February. Local government hiring declined 15,000 during March after a loss of 30,000 jobs were recorded in February; this wing of government is the weakest sector and presents challenges in the months ahead.
Chart 4
Although, payrolls grew at a significant pace, personal income is most likely to post only a moderate increase in March as hourly earnings were unchanged at $22.87 in March. The 0.5% gain in the manufacturing man-hours index suggests an increase in factory production in March but at a slower pace compared with the 0.6% jump posted in February.
Conclusion – In the inflation-growth debate, the Fed is focused on promoting growth, for now. Recent trends in oil and food prices have raised the level of concern about inflation. Crude oil, as measured by quotes of West Texas Intermediate is trading around $107 a barrel, with the average for March 2011 at $103.00 vs.around $90.00 in the prior month. Food prices have also climbed rapidly in recent months. The Food and Agriculural Organization (FAO) has indicated that food prices recorded the eighth consecutive monthly gain in February and the level of the food price index is the highest since January 1990.
The credibility of the Fed is tied to its resolve as an inflation fighter. In recent weeks, several hawkish Fed Presidents have pointed out the need to tighten monetary policy. Essentially, there is a range of opinions within the Fed about the current stance of easy monetary policy. In the March 15 policy statement, the Fed noted that these commodity price shocks are “transitory events.” In other words, the Fed views the recent increases in prices of energy and food as changes in relative prices. The Fed would consider tightening monetary policy if the gains of these commodity prices spillover to prices of other goods and services.
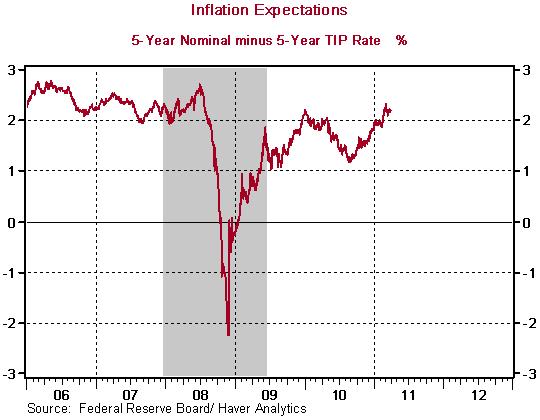
Comparing the situation in late-2007 when oil prices held at levels close to the level seen in the three-months ended February 2011, a worrisome spillover from rising energy and food prices has not occurred yet (see table alongside). The Fed’s preferred inflation measure, the core personal consumption expenditure price index, rose at an annual rate of 1.35% during the three-months ended February 2011 compared with a 2.77% increase in the last three-months of 2007. The high unemployment rate, the limited spillover effect of rising commodity prices, and contained inflation expectations (see Chart 6) allow the Fed to continue the QE2 program during the April-June period.
Chart 5
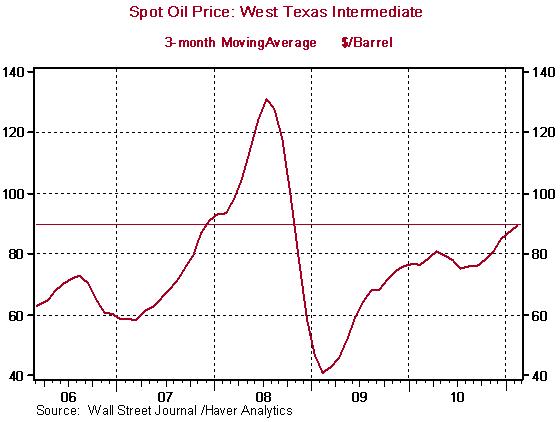
*- average price, inflation measures are 3-month annualized percent change
Chart 6
Asha Bangalore — Senior Vice President and Economist
http://www.northerntrust.com
Asha Bangalore is Vice President and Economist at The Northern Trust Company, Chicago. Prior to joining the bank in 1994, she was Consultant to savings and loan institutions and commercial banks at Financial & Economic Strategies Corporation, Chicago.
Copyright © 2011 Asha Bangalore
The opinions expressed herein are those of the author and do not necessarily represent the views of The Northern Trust Company. The Northern Trust Company does not warrant the accuracy or completeness of information contained herein, such information is subject to change and is not intended to influence your investment decisions.
© 2005-2022 http://www.MarketOracle.co.uk - The Market Oracle is a FREE Daily Financial Markets Analysis & Forecasting online publication.
Comments
|
tony nulty
07 Apr 11, 13:44 |
QE2
At what date is the Fed expected to start QE2. thanks. |


