What is the U.S. Employment Picture in Really Saying?
Economics / Employment Mar 31, 2011 - 02:52 AM GMTBy: Mike_Stathis
 Jobs Data - As in previous months, the private sector accounted for all the job gains in February, with an addition of 222,000 positions, up from a mere 68,000 job additions in January. This represented the largest gain since April 2010. Does this represent a sign of recovery?
Once you examine these job additions, you will see that the trend of low-wage, low/no-benefit, dead-end jobs remains firmly intact. [1]
Payrolls in the goods-producing industries saw a weather-related bounce of 70,000, with construction increasing 33,000 after shedding 22,000 jobs in January. Manufacturing, a sector that is powering the “recovery,” added 33,000 jobs. So is manufacturing making a come back in the U.S.? See for yourself.
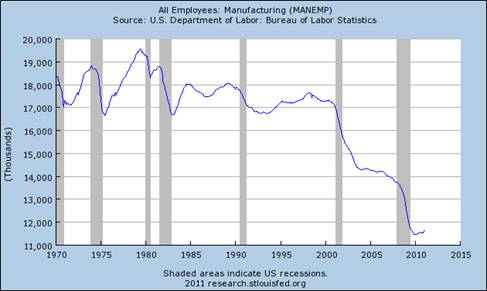
America’s shrinking job base has been China’s gain. Instead of paying for goods to support U.S. jobs as was the case decades ago, U.S. consumers continue to send money overseas to buy everything from cars and consumer electronics, to prescription drugs and furniture. This trade deficit has added to America’s massive national debt, while China adds to its massive trade surplus and foreign reserves. The fact is that anytime you see a trade deficit, it means jobs are being sent overseas. [2]
I have discussed this in detail on numerous occasions dating back to the 2006 release of America’s Financial Apocalypse.
Government employment fell 30,000, contracting for a fourth straight month, pulled down by state and local governments facing heavy budgetary pressures. Does this data represent a trend reversal? I wouldn’t bet on it. There’s a good reason why the D.C. real estate market has held up relatively well over the past couple of years, as Washington continues to add more welfare jobs to its payrolls.
Unemployment Data
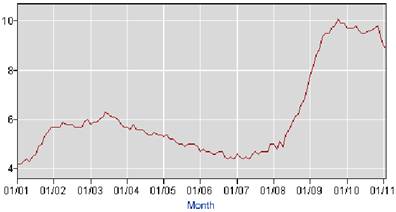
According to the official data from the March Current Population Survey, the unemployment rate dropped by 0.4%, clipping the total U-3 unemployment rate down to 8.9%. This represents the lowest jobless rate in two years. However, much of these gains came from more workers falling into the discouraged worker category, so they are no longer counted in the official data. Regardless, this data is likely to be well-received by the Street, adding to the wave of optimism.
As I have discussed in the past, the (U-3) unemployment rate during the current economic correction surpassed that seen in the recession of the 1980s after adjusting for age. However, the BLS has not made these adjustments. Several other changes have been made to the calculation of this data over the decades serving to deflate the real unemployment data. But note that even as reported, the change in unemployment has been the highest on record.
Labor Force Statistics from the Current Population Survey
Series Id: LNS14000000
Seasonally Adjusted
Series title: (Seas) Unemployment Rate
Labor force status: Unemployment rate
Type of data: Percent or rate
Age: 16 years and over
Next, we look at the 1-month change in unemployment.
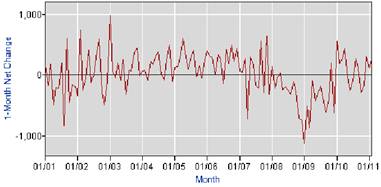
The next chart is the same as the previous one, except I have marked it up to point out the course of unemployment changes over the past decade.
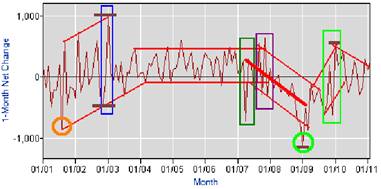
Notice the upward trend in the change in employment, beginning in mid-2001. After 9-11, the numbers collapsed, but remained higher than the bottom made a few months earlier.
In 2002, the data continued to post higher highs and lower lows, peaking at the end of 2002.
Towards the end of 2002, the change in employment increased by the largest margin over the shortest time frame. By year’s end, it had peaked. Recall that the stock market made its bottom in October 2002, and then soared. This is no coincidence.
In early 2003, the data corrected and remained in a narrow range through 2007. By this time, the economy had reached full employment, with unemployment at around 4.9%. As a result, the change in employment collapsed below the level seen in late 2002 when the economy had begun to rebound (compare green box with blue). The decline came very close to that seen during the peak of the dotcom recession in 2001 (orange circle).
In the spring of 2007, the first major warning sign surfaced with regards to troubles in the sub-prime market, although there were several other warning signs present in late 2006 (green box).
By mid-2007, the change in employment mounted a strong rebound (purple box). This would turn out to be a head-fake. Thereafter, it trended downward with greatly reduced volatility. As you can see, the range was reduced relative to the previous periods. As a result, I have drawn a mean trend line (thick red line) to illustrate the formation of a strong downward trend.
By early 2009, the change in employment bottomed (lime circle) at a point even below the lows reached in mid-2001 (orange circle). The big move came towards the end of 2009 (lime box). However, this level remained below the previous highs made during the dotcom recovery. Thereafter, the monthly change in unemployment has been trending downward.
Thus, from this (rough) charting analysis alone, we can see that the current economic collapse is much more severe than the dotcom recession. As well, the data does not show compelling evidence of a full recovery in employment.
Since the current “recession” is of much higher severity, we should expect to see a much stronger or else a definitive and longer lasting uptrend in the change in employment. As the chart shows, there are no signs of real improvement in the employment picture. Without meaningful improvement in the employment picture, there can be no real recovery. [3] [4]
Next we examine the official number of unemployed Americans, as reported by the Labor Department’s Current Population Survey. As you can see, the official number of unemployed stands at 15 million. However, this data is based on the U-3, so it does not include discouraged workers, and does not count the underemployed. In the past, I have made the claim that the real number of unemployed after adjusting for these factors is over 33 million.
Series Id: LNU03000000
Not Seasonally Adjusted
Series title: (Unadj) Unemployment Level
Labor force status: Unemployed
Type of data: Number in thousands
Age: 16 years and over
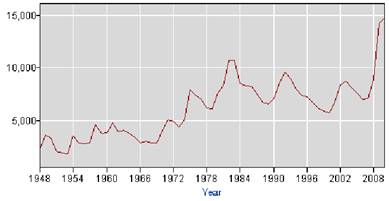
Next we examine the employment population ratio (the proportion of the civilian noninstitutional population that is employed). This data aims to provide a better idea about unemployment versus employment capacity. Notice the magnitude of the decline. This is a key indicator because it serves to minimize the effects of changes to employment methodologies that have occurred over the reported period. As you can see, the magnitude of the decline is clearly larger than any recession since the post-war period.
Series Id: LNS12300000
Seasonally Adjusted
Series title: (Seas) Employment-Population Ratio
Labor force status: Employment-population ratio
Type of data: Percent or rate
Age: 16 years and over
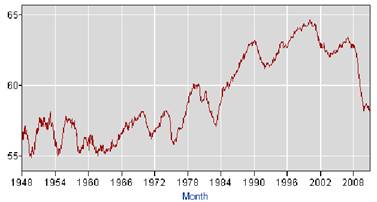
I have modified the final chart (below) to illustrate the employment-population ratio after adjusting for U.S. demographic changes since the mid-1980s. As you can see, based on this very rough adjustment, the ratio has been reduced significantly.
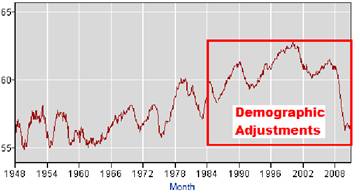
Keep in mind this chart does not adjust for the numerous changes made in calculation of employment data (primarily since the early 1990s). Adjusting for these changes would surely lower the employment population ratio to below 50.
Finally, consider that the period of acceleration of this ratio from the late 1980s through the pre-crisis period was achieved via a massive credit bubble. This leverage did not exist prior to the 1980s.
While a deleveraging period is greatly needed in order to cleanse the economy, it should be apparent by now that neither Washington nor the Federal Reserve have any plans to do so. In fact, they are continuing with the same activities that led to the current economic collapse.
Meanwhile, as I predicted in America’s Financial Apocalypse, once the wealth effect vaporized, U.S. consumers would be subject to the poor effect, causing them to save more of their disposable income. This is precisely what we have seen.
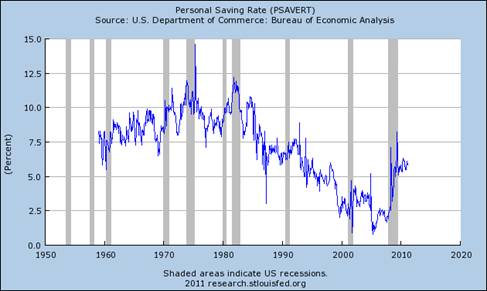
However, Washington continues to encourage the same type of irresponsible consumer spending that in part led to the current economic mess. Meanwhile, the Federal Reserve is working overtime to steal savings from Americans through artificial suppression of interest rates. This is also leading to widening pension deficits as well as global inflation which has reached worrisome levels in Asia and Latin America.
Below I have posted the U-3 unemployment data according to the duration of unemployment. This data is very important to consider.
Historically, the U.S. labor market has shown signs of recovery 12 months after the end of the recession. Twenty-one months after the official end of the recession and the labor market still shows no signs of recovery. Today, nearly 1 out of every 2 unemployed Americans has been without work for at least 6 months. But the real data is much worse. Discouraged workers are not counted in this data, and many individuals have gotten short-term jobs they know won’t last so they can re-qualify for unemployment benefits
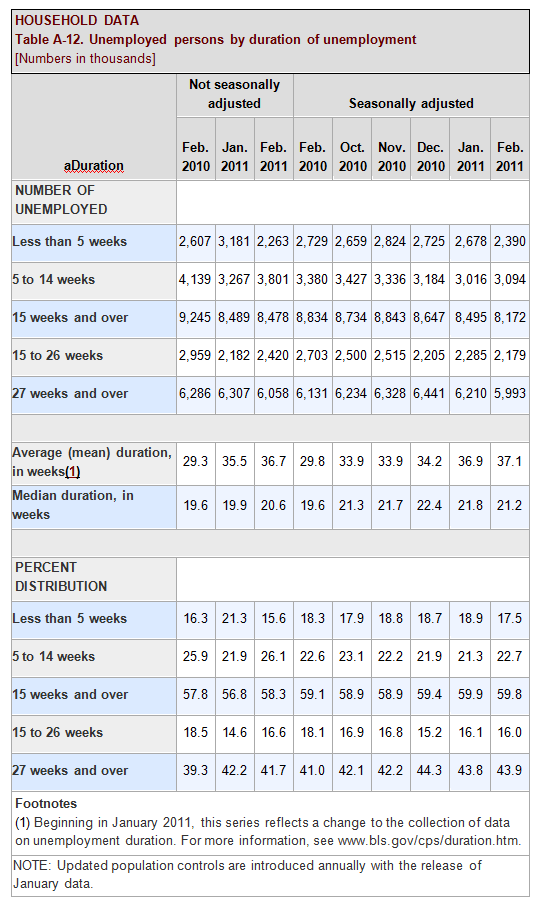
However, the BLS recently made a very interesting announcement. Have a look.
“Effective with data for January 2011, the Current Population Survey (CPS) was modified to allow respondents to report longer durations of unemployment. Prior to that time, the CPS accepted unemployment durations of up to 2 years; any response of unemployment duration greater than this was entered as 2 years. Starting with data for January 2011, respondents are able to report unemployment durations of up to 5 years. This change affects estimates of average (mean) duration of unemployment. The change does not affect the estimate of the number of unemployed persons and does not affect other data series on the duration of unemployment.
There has been an unprecedented rise in the number of persons with very long durations of unemployment during the recent labor market downturn. Nearly 11 percent of unemployed persons had been looking for work for about 2 years or more in the fourth quarter of 2010. Because of this increase, BLS and the Census Bureau updated the CPS instrument to accept reported unemployment durations of up to 5 years. This upper bound was selected to allow reporting of considerably longer durations while limiting the effect of erroneous extreme values (outliers).
Basically the BLS is acknowledging that chronic unemployment is such a problem that they are now recording this data. However, those who have been chronically unemployed prior to 2011 won’t be counted.
They continue.
“The new upper bound of 5 years for reported unemployment duration is being phased in over the first 4 months of 2011, as the duration question is only asked of a portion of those unemployed in any given month. By April 2011, all households will have been able to report the new duration upper limit.
Because of the previous upper limit on recorded values, BLS cannot determine the duration of unemployment for persons who had been unemployed for longer than 2 years for data prior to January 2011. Monthly estimates of average (mean) duration of unemployment for 2011 produced using the 5-year upper limit are higher than those using the 2-year upper limit. Only the average (mean) duration of unemployment was affected by this change in data collection. The median duration of unemployment was not affected by this change, nor were distributions of unemployment by weeks unemployed.”
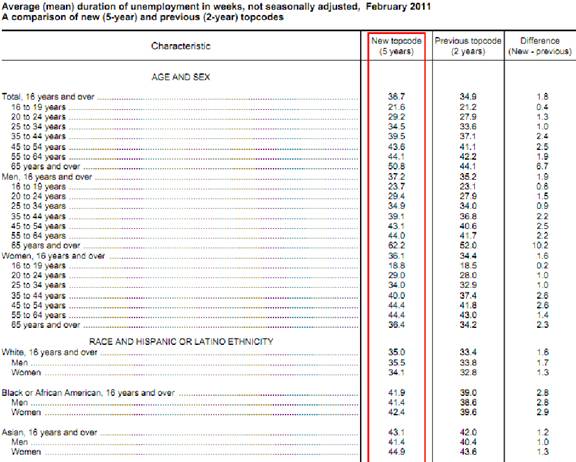
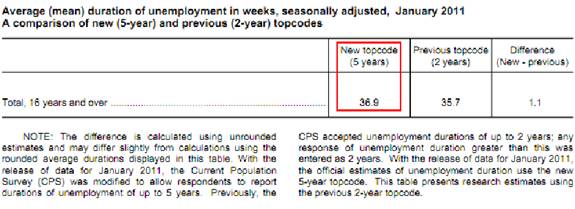
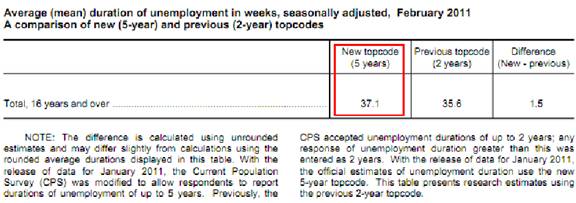
Using data from the NBER, the BLS published a piece discussing the unique unemployment situation see in the “previous” recession. The following is a summary of that piece.
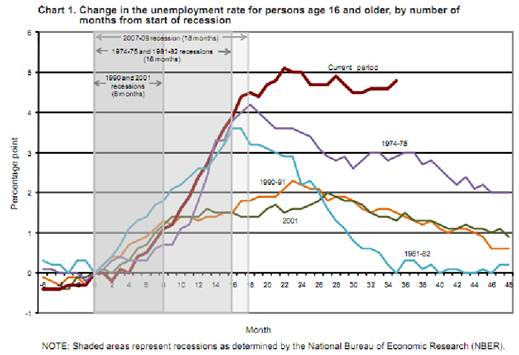
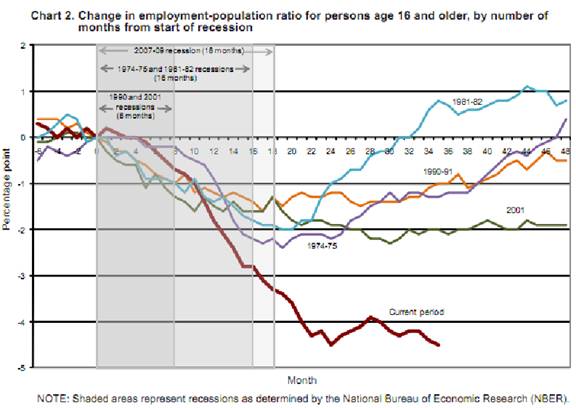
“The unemployment rate increased more sharply and the employment-population ratio decreased more precipitously during the 2007-09 recession than in any of the other post WWII recessions. In the first 17 months after the cyclical trough in June 2009, both measures have been relatively slow to recover.
The unemployment rate rose significantly in each of the last five recessions, but the most recent recession stands out as having a particularly sharp increase in the rate. At the trough of the recent recession in June 2009, the unemployment rate was 9.5 percent, 4.5 percentage points higher than at the start of the recession. The rate reached 10.1 percent in October 2009, 4 months after the trough, before declining at the start of 2010. By November 2010, the unemployment rate had not shown much net improvement, standing at 9.8 percent. The largest increase in the unemployment rate in the 1981–82 recession was 3.6 percentage points (to 10.8 percent); for the 1974–75 recession, 4.2 percentage points (to 9.0 percent). Jobless rate increases in the 2001 and 1990–91 recessions were of much smaller magnitudes.
The decline in the employment-population ratio during and after the recent downturn was much larger than that of any of the other four recessions covered in this analysis. The largest declines in the employment-population ratio for the four prior recessions covered in this analysis were about half of the decline for the 2007–09 recession.
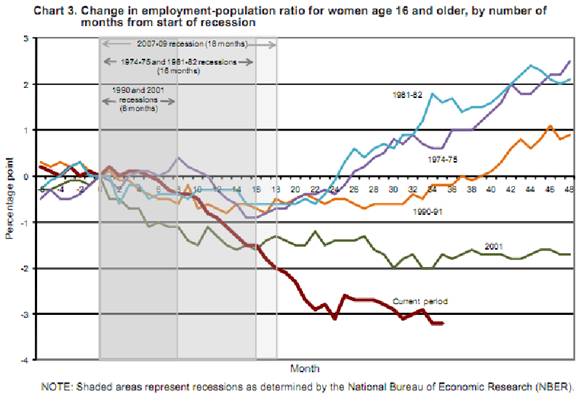
During the 2007–09 recession, men accounted for the majority of the employment loss and experienced a greater percentage point decrease in their employment-population ratio than did women. This pattern is similar for past recessions.
In summary, the December 2007 to June 2009 recession was characterized by a larger increase in the unemployment rate and a sharper decline in the employment-population ratio than any of the other post-WWII recessions.”
“By the official end of the “previous” recession, about 46 percent of the 14.6 million unemployed persons were jobless for 27 weeks or longer and about 31 percent (4.5 million) were unemployed for 52 weeks or longer.(1)
Men made up 61.3 percent of those unemployed for a year or more, compared with 58.1 percent of total unemployment in the second quarter of 2010.
Persons aged 16 to 24 accounted for a considerably smaller share of year-or-longer unemployment than of total unemployment, partially a reflection of the fact that younger persons are more likely to drop out of the labor force than the older unemployed.
Whites made up nearly 74 percent of all unemployed persons and 70 percent of those jobless for a year or more. Blacks accounted for 19.1 percent of total unemployment and made up 22.7 percent of the ranks of those unemployed for a year or more. Persons of Hispanic or Latino ethnicity made up 16.7 percent of those jobless for a year or more, compared with 18.4 percent of unemployed persons.
By educational attainment, the distribution of those jobless for a year or more was similar to the distribution for total unemployment. Joblessness for a year or longer has increased regardless of educational attainment.”
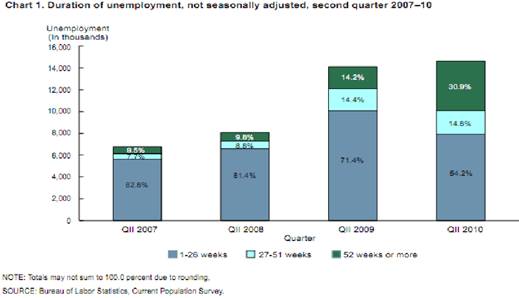
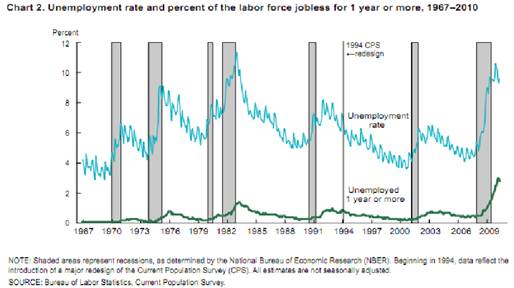
The mystery behind the lingering unemployment levels can be explained by the fact that the recession is still ongoing. It has now surpassed the duration of the longest recession seen during the Great Depression.
Wall Street continues to hype up the slightest improvements when the reality is much different. This campaign of deceit has been good for those of us who are bullish on the U.S. equity markets.
However, the picture is changing each week. The combined effects of soaring commodity prices, turmoil in the Middle East, lingering high unemployment in the U.S. with no efforts by Washington to address the issue, a real estate market in the U.S. that continues to weaken, continued problems in Europe, and the catastrophic events in Japan – have added to already worrisome levels of global economic and financial risk.
But apparently, the Wall Street cheerleaders continue to charge forward, full steam ahead, with no regard for mounting risks. [5]
"We have moved into the expansion phase of the economic cycle and the economy is self-sustaining." (Brian Levitt, OppenheimerFunds economist)
"The numbers confirm that labor market conditions are gradually improving." (Mohamed El-Erian, co-chief investment officer of PIMCO)
While corporate earnings have largely been quite good, profit margins have no where to go but down from here. By the time we enter the second half of 2011, we are likely to see the cumulative effects of global risk impact the global equities market.
The lack of real job growth, combined with the absence of real wage hikes confirms that there will be no double dip recession, as the recession which began in December 2007 has not yet ended. The current recession has now surpassed the longest recession from the Great Depression. [6]
Unfortunately, America’s Second Great Depression will persist for years to come, and will be made worse if Washington continues to ignore the fundamental economic problems of unfair trade, the broken healthcare system and pension deficits. [7] [8] [9] [10]
Many analysts seem mystified that the U.S. housing market continues to worsen despite the fact that the main source of housing demand remains in the dumps. A rebound in the real estate market itself will not help the economic recovery. A strong housing market is a reflection of a robust economy, much as the case with a strong dollar. [11]
Creating a fictitious wealth effect through housing and stock market appreciation only sets the U.S. up for another fall before it has had time to recovery from the current one. Americans do not want or need a “wealth effect” that has only meaning on paper. They want to increase their wealth in real terms so they can afford to buy goods and services without being held by the leash of the criminal and exploitative financial industry.
The only way to produce real wealth is by creating good jobs and making sure that the opportunities are equally distributed. Once consumers have been provided with good jobs with wage increases, the real estate market will rebound. Any reported progress prior to these conditions being met will only lead to more smoke and mirrors.
Only by removing the risks of corporate failure from consumers back to corporations will America be positioned to recover from America’s Second Great depression. Such a feat cannot be accomplished so long as America’s fascist government remains in power.
Notes:
(1) On September 20, 2010 the National Bureau of Economic Research declared that the recession that began in December 2007 ended in June 2009. As measured by the Current Population Survey, a person is counted as unemployed if they do not have a job, have actively looked for work in the last 4 weeks, and are currently available for work. The duration of unemployment represents the length of time (through the current reference week) that individuals classified as unemployed have been looking for work and refers to job searches in continuous progress rather than the duration of a completed spell. All estimates in this report are not seasonally adjusted.
At AVA investment Analytics we publish 3 monthly newsletters in addition to providing custom research for and consulting for financial institutions.
See here for more information on the Intelligent Investor.
See here for more information on Dividend Gems.
See here for more information on the Market Forecaster.
See here for our special limited-time promotion.
References
[1] http://www.avaresearch.com/article_details-154.html
[2] http://www.avaresearch.com/article_details-74.html
[3] http://www.avaresearch.com/article_details-444.html
[4] http://www.avaresearch.com/article_details-149.html
[5] http://www.avaresearch.com/article_details-72.html
[6]http://www.avaresearch.com/article_details-579.html
[7] http://www.avaresearch.com/article_details-663.html
[8] http://www.avaresearch.com/article_details-668.html
[9] http://www.avaresearch.com/article_details-672.html
[10] http://www.avaresearch.com/article_details-83.html
[11] http://www.avaresearch.com/article_details-618.html


By Mike Stathis
www.avaresearch.com
Copyright © 2010. All Rights Reserved. Mike Stathis.
Mike Stathis is the Managing Principal of Apex Venture Advisors , a business and investment intelligence firm serving the needs of venture firms, corporations and hedge funds on a variety of projects. Mike's work in the private markets includes valuation analysis, deal structuring, and business strategy. In the public markets he has assisted hedge funds with investment strategy, valuation analysis, market forecasting, risk management, and distressed securities analysis. Prior to Apex Advisors, Mike worked at UBS and Bear Stearns, focusing on asset management and merchant banking.
The accuracy of his predictions and insights detailed in the 2006 release of America's Financial Apocalypse and Cashing in on the Real Estate Bubble have positioned him as one of America's most insightful and creative financial minds. These books serve as proof that he remains well ahead of the curve, as he continues to position his clients with a unique competitive advantage. His first book, The Startup Company Bible for Entrepreneurs has become required reading for high-tech entrepreneurs, and is used in several business schools as a required text for completion of the MBA program.
READ THIS LEGAL NOTIFICATION IF YOU INTEND TO REPUBLISH ANY PORTION OF THIS MATERIAL
Market Oracle has received permission rights to publish this article. Any republications of this article or any others by AVA Investment Analytics must be approved by authorized staff at AVA Investment Analytics. Failure to do so could result in legal actions due to copyright infringement.
Our attorneys have determined that the so-called “Fair Use” exemption as it applies to the Digital Millennium Copyright Act does not permit use by websites that have ads or any other commercial application.
In addition, fair use does not imply articles can be republished or reproduced. The distinction between fair use and infringement may be unclear and not easily defined. There is no specific number of words, lines, or notes that may safely be taken without permission. Acknowledging the source of the copyrighted material does not substitute for obtaining permission. Please see this statement from the U.S. Copyright office for more information. http://www.copyright.gov/fls/fl102.html
Requests to the Publisher for permission or further information should be sent to info@apexva.com
Books Published
"America's Financial Apocalypse" (Condensed Version) http://www.amazon.com/...
"Cashing in on the Real Estate Bubble" http://www.amazon.com/...
"The Startup Company Bible for Entrepreneurs" http://www.amazon.com...
Disclaimer: All investment commentaries and recommendations herein have been presented for educational purposes, are generic and not meant to serve as individual investment advice, and should not be taken as such. Readers should consult their registered financial representative to determine the suitability of all investment strategies discussed. Without a consideration of each investor's financial profile. The investment strategies herein do not apply to 401(k), IRA or any other tax-deferred retirement accounts due to the limitations of these investment vehicles.
© 2005-2022 http://www.MarketOracle.co.uk - The Market Oracle is a FREE Daily Financial Markets Analysis & Forecasting online publication.
Comments
|
S B
31 Mar 11, 23:01 |
U.S. economy
Thank for your research Mike. You do a great job of explaining where the U.S. economy is actually headed in the months and years to come. |


