


Stock Market Cycle Turning Points Analysis - Large Caps Oversold Expectations of Uptrend to Resume
Stock-Markets / US Stock Markets Nov 04, 2007 - 05:19 PM GMTBy: Andre_Gratian

 Current Position of the Market.
SPX: Long-Term Trend - The 12-yr cycle is approaching its mid-point and some of its dominant components are topping and should soon restrain the bullish effect of the 4.5-yr. This could lead to another period of consolidation in 2008 with an eventual bull market top in 2009-2010.
SPX: Intermediate Trend - The intermediate-term trend has been up since the 4.5yr cycle low in August and
is currently correcting.
Analysis of the short-term trend is done on a daily basis with the help of hourly charts. It is an important adjunct to the analysis of daily and weekly charts which determines the course of longer market trends.
Daily market analysis of the short term trend is reserved for subscribers. If you would like to sign up for a FREE 4-week trial period of daily comments, please let me know at ajg@cybertrails.com .
Overview
Three weeks ago, most of the major indices made new bull market highs and they have been correcting ever since. The first leg of the correction took the SPX from its high of 1576 down to 1489. The anticipation and expectation that the Federal Reserve would cut interest rates again rallied prices to 1552, but this was promptly followed by another leg down to 1493 on Friday, although the index did close up for the day.
The financial sector, still reeling from the effects of the sub-prime problems, was the main factor behind Friday's weakness and sent the Banking Index from its all-time high in February to a new low for the year. This sector has a strong influence on the SPX and, as we will see later, could be one of the primary forces behind its recovery and continued uptrend over the next few weeks.
The early part of next week will be very important in assessing the nature of this decline. This is when the cycles which are behind the correction are expected to make their lows, but the degree of weakness which remains will also be a clue in determining whether or not this was only a corrective move, or the beginning of something bigger.
What’s Ahead?
Momentum:
We are going to look at two charts (courtesy of StockCharts): The Daily SPX and BKX.
The analysis of the former will be inconclusive because we really need a few more days of data to draw firm conclusions. That extra time could make a significant difference in the pattern that is under construction. As of now, it looks like a normal correction of the move from the 8/16 low to the recent top at 1576.
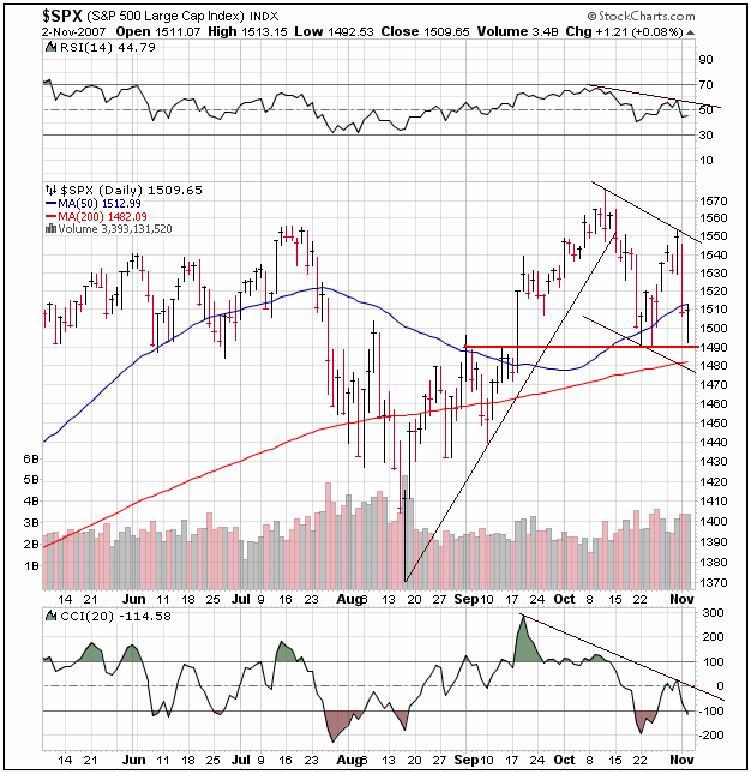
There is nothing particularly negative about this chart. Both moving averages are still moving up and the 50- dma is still far above the 200-dma. The volume pattern is, at worst, neutral. And the CCI (lower momentum indicator) has retraced to a mildly oversold condition. The price found good support where it should have on Friday and had a good rebound. But all this is probably without much meaning until we see what happens over the next two or three days.
On 10/19 the SPX was down 40 points but found support the next day and had a good rebound. After a test of that low a couple of days later, it went back into an uptrend. So far, the pattern of the last two days is strikingly similar with a 40 point decline followed by a rebound the next day. Are we about to duplicate the former pattern?
Because of its impact on the SPX the next chart, that of the Banking Index, is much more interesting and can give us some clues about the future direction of the broader index.
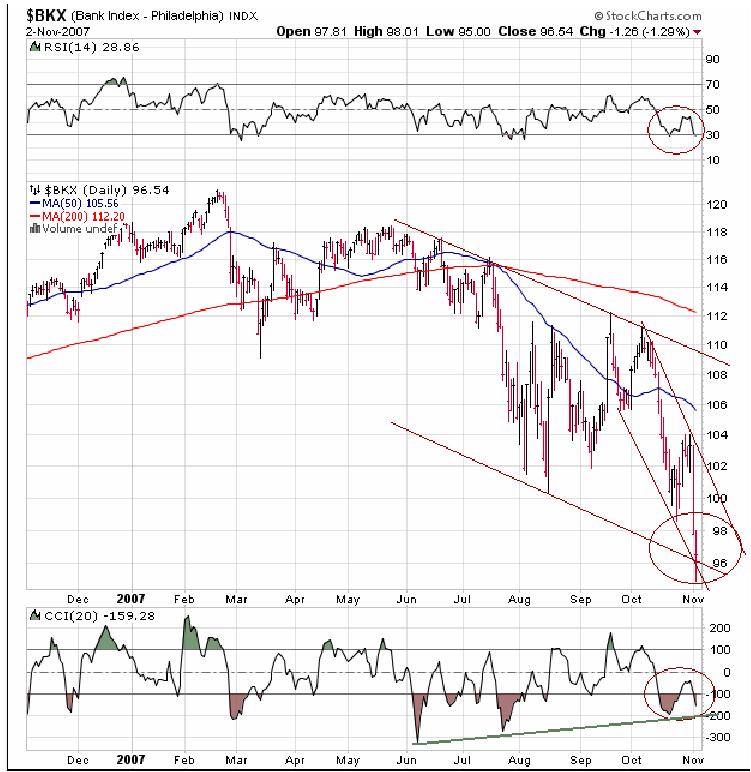
First, note that the BKX is extremely oversold and is at the juncture of two down channel lines which should provide some good support. The momentum indicators are also oversold and the CCI, especially, is showing both longer-term and shorter-term positive divergence. Finally, the index has completed a 5-wave decline from its February top and the final wave is also composed of 5 segments and looks very climactic.
Taking all these factors into consideration, it seems likely that the index is ready for a rally but probably cannot do so without taking the SPX with it!
Cycles
There is a nest of short-term cycles which are currently making their lows. All except one (the 6-wk cycle)
have already bottomed and, ideally, this one is due in the next 2 or 3 days.
The 10-wk cycle low is already behind us, and the 12-mo may be as well. This could be a re-test of its low. If this is the case, the larger cycles, in conjunction with the shorter-term cycles that have already bottomed, could provide enough support for the 6-wk and prevent it from going beyond Friday's 1493 low. If, on the other hand, the 12-mo is just now bottoming, we could easily move lower over the next few days.
Cycles only play a part in determining market direction. Economic news also plays a part, and that, affecting the financial sector last week, was super negative. This is why the technical position of the Banking Index is so critical to the direction of the market next week. If, as the chart above indicates, is it wrung out on the downside, then this level should hold and an important bottom could form over the next few days.
It is possible that the 2-yr and 6-yr cycles have already topped and are exerting enough downside pressure to offset the bullish effect of the 4.5-yr cycle. But many pieces to an important top are still missing.
Projections
The current decline may have met its downside projection on Friday when the SPX touched 1493. If there is a follow-through to the downside, about 1485 has a good chance of being the final low. Anything much below that will probably have bearish implications for the intermediate term and severely curtail current expectations that the index will make a new high by January 2008.
Breadth
Two weeks ago, I wrote: "… the negative divergence which is showing in the McClellan oscillator is of concern for the immediate future." Now we have the opposite: positive divergence is developing. I stress "developing", because the pattern will be bullish only if the oscillator does not make a new low along with price over the next few days.
The McClellan Summation Index is correcting and may already be forecasting that a larger correction lies ahead, but probably not now. The SPX could still rally to a new high while the SI fails to do the same. That would be a bearish signal for the intermediate-term.
Market Leaders & Sentiment
In the first wave down from its bull market high, GE matched the weakness in the SPX. However, the stock is handling the current decline much better than the index and this has some bullish connotations.
But the real star of positive divergence is the NDX. It made a new recovery high on Wednesday of last week, and on Friday, the QQQQ closed only about 50 cents below that high. The disparity comes from the recent performance of the banking stocks which have little effect on the NDX.
A note of caution: the NDX is long-term overbought and nearing the top of its channel where is it likely to find some resistance.
The ISEE (put/call ratio indicator) is still not at a level associated with important tops.
Summary
In the past week, the large caps have been severely affected by the weakness of the financial sector, but that index appears to be very oversold and ready for a good rebound. If this happens, it should have a positive effect on the indices.
The technical aspects of the market are, on balance, slightly positive and the strong positive divergence exhibited by the NDX makes it unlikely that 1576 was a significant top.
A market advisory service should be evaluated on the basis of its forecasting accuracy and cost. This service is probably the best all-around value. Two areas of analysis that are unmatched anywhere else -- cycles and coordinated Point & Figure and Fibonacci projections -- are combined with other methodologies to bring you weekly reports and frequent daily updates.
The following are examples of unsolicited subscriber comments:
What is most impressive about your service is that you provide constant communication with your subscribers. I would highly recommend your service to traders. D.A.
Andre, You did it again! Like reading the book before watching the movie! B.F.
I would like to thank you so much for all your updates / newsletters. as i am mostly a short-term trader, your work has been so helpful to me as i know exactly when to get in and out of positions. i am so glad i decided to subscribe to turning points. that was one of the best things i did ! please rest assured i shall continue being with turning points for a long while to come. thanks once again ! D.P.
But don't take their word for it! Find out for yourself with a FREE 4-week trial. Send an email to ajg@cybertrails.com .
By Andre Gratian
MarketTurningPoints.com
A market advisory service should be evaluated on the basis of its forecasting accuracy and cost. At $25.00 per month, this service is probably the best all-around value. Two areas of analysis that are unmatched anywhere else -- cycles (from 2.5-wk to 18-years and longer) and accurate, coordinated Point & Figure and Fibonacci projections -- are combined with other methodologies to bring you weekly reports and frequent daily updates.
“By the Law of Periodical Repetition, everything which has happened once must happen again, and again, and again -- and not capriciously, but at regular periods, and each thing in its own period, not another’s, and each obeying its own law … The same Nature which delights in periodical repetition in the sky is the Nature which orders the affairs of the earth. Let us not underrate the value of that hint.” -- Mark Twain
You may also want to visit the Market Turning Points website to familiarize yourself with my philosophy and strategy.www.marketurningpoints.com
Disclaimer - The above comments about the financial markets are based purely on what I consider to be sound technical analysis principles uncompromised by fundamental considerations. They represent my own opinion and are not meant to be construed as trading or investment advice, but are offered as an analytical point of view which might be of interest to those who follow stock market cycles and technical analysis.
Andre Gratian Archive |
© 2005-2022 http://www.MarketOracle.co.uk - The Market Oracle is a FREE Daily Financial Markets Analysis & Forecasting online publication.