


Global Stock Markets Heading Sharply Lower - Fingers of Instability - Part 10
Stock-Markets / Global Stock Markets Oct 22, 2007 - 02:08 AM GMTBy: Ty_Andros

 In This Issue – 2 Fingers of Instability
- Implosions Lower and Explosions Higher!
- Deadbeats
Introduction
We began the latest series of “Fingers of Instability” in August as the fingerprints of what's unfolding became apparent. At that time we started to detail the fingerprints of the unfolding debacle known as “over the counter” derivatives known as CDO's, CMO's, MBS's, (Collateralized debt and mortgage obligations converted into securities) and all sorts of alphabet soup investments which are opaque, complex, and illiquid.
Fingers of Instability are, by definition, inflationary episodes (bubbles) followed by deflationary episodes (popped bubbles) in asset classes that have gone ahead of themselves from the fire hoses of hot money seeking alpha in a fiat currency and credit-dependent world. As I outlined last week the reason these “over the counter” products were invented was to meet the demand of the investment needs of the recipients of the tremendous G7 central bank money printing over the last 30 years.
This finger of instability is the correction of “irrational exuberance” caused by Alan Greenspan's complete and total disregard of the Taylor rule during the 2001-2005 time period. Fingers of instability are investment opportunities and they will appear over and over again as the “CRACK UP BOOM” continues to unfold over the coming decade. You must look over your portfolio at times like these and ask yourself “Are these opportunities or pitfalls in your portfolio?” If they are the former you are well prepared, if the latter, it's time to do your homework.
The last 90 days has tried our patience as we have watched the marketplace, the financial and banking authorities, and the main stream financial media wrestle with the systemic risk posed by the foolishness and reckless greed of the biggest banks, investment banks and their quantitative investment community high priests. The problem I have with quants is that the models NEVER account for everything. They fall in love with the math, and as any man or woman knows, when love enters the picture insanity is quite often an apt description of behavior at those times. You always hear talk of events that should only happen every 100 or 500 years happening every 5 or 10 years. 6 or 7 standard deviation events ALWAYS upset their best laid plans. These are poor investments in reality, in the model shops of the quants they are wonderful.
Just as climatologists whose “mathematical” climate models cannot accurately predict the weather in 30 days claim they can do it for 100 years. The models used by the quants are equally impotent in modeling investor behavior. In both cases, there are too many “unknowable” variables to properly model. Qualitative analysis (market liquidity, transparency and risk controls, etc.) are critical to investing successfully and to not do it results in what we are about to see in the markets. Now we are on the edge of a cliff and it appears the unfolding activities of the last week have pushed us over the precipice.
There is one thing you can count on now, next week, next month and next year in response to trouble in the “ASSET” backed economies of the G7 and that is that they will “print the money”! A number of OTHER very troubling tea leaves emerged this week as well . The August TIC”s data from August showed a net outflow of dollars from the United States of 69 billion dollars which represents CAPITAL flight as foreign investors withdrew from their US investment holdings and refused to finance new borrowings . This is important as the US needs 2 Billion dollars a day of foreign investments just to cover the budget and trade deficits. If that does not occur it signals that higher returns must be paid to attract the inflow. The second was that the dollar descended to new lows signaling decreased purchasing power and higher inflation for everything we import --and we import alot.
Little reported in the financial press was Treasury Secretary Hank Paulson estimating that 1 million homes will go into foreclosure in the next 15 months . Probably a very accurate projection as little more than 1% of the ARM's have refinanced so far. Lenders “ARE NOT” reaching out to mortgage holders to renegotiate or refinance, so it's “ARM”ageddon on an individual and “over the counter” (CDO's, CMO's, MBO's, Asset backed commercial paper) investor basis. Banking giants Wachovia and Bank of America missed their already lowered earnings estimates by wide margins and spoke/warned of more to come. So the losses are all still mostly in front of us.
On Friday several European SIV's were declared in default of their commercial paper obligations, signaling a building inability to finance themselves in the commercial paper markets. John Mauldin reports:
This is not just a US bank problem. "Rhinebridge Plc, a structured investment vehicle run by IKB Deutsche Industriebank AG, said it may not be able to pay back debt related to $23 billion in commercial paper programs. Rhinebridge suffered a 'mandatory acceleration event' after IKB's asset management arm determined the SIV may be unable to repay debt coming due, the Dublin-based fund said in a Regulatory News Service release. A mandatory acceleration event means all of the SIV's debt is now due, according to the company's prospectus.
"Rhinebridge, which was forced to sell assets after being shut out of the commercial paper market, said it must now appoint a trustee to ensure that the interests of all secured bondholders are protected." (Bloomberg)
This was a fund that was set up in June of this year. It is less than five months old. From the PR which accompanied the offering, apparently delivered with a straight face:
"The vehicle's unusual three-tier capital structure is designed to reduce the probability of enforcement and will allow an expected launch size of US$2.5bn. IKB has a strong co-investment commitment in the capital notes.
"Although a new SIV manager, IKB has successfully advised an ABCP conduit for five years. The team has a strong track record in managing the asset classes targeted for the portfolio, which is expected to launch with a high home equity loan exposure.
Rhinebridge's portfolio will comprise approximately 33% of seasoned triple-A, double-A and single-A bonds, as well as 67% new issue triple-A bonds."
So, this fund was leveraged about 10:1. Now, here's the kicker. Fitch Ratings gave Rhinebridge Plc's commercial paper and medium-term notes expected ratings of F1+ and triple-A respectively. The agency also assigned its senior capital notes, mezzanine capital notes, and combination notes expected ratings of triple-A, single-A and triple-B respectively. John can be reached at john@frontlinethoughts.com
Wow, triple, double and single A paper reduced to almost NOTHING and 23 billion dollars of commercial paper holders facing default. OUCH. THERE WILL BE TEN TIMES THIS AMOUNT OF CARNAGE BEFORE THIS IS OVER!
A lot of commercial paper is slated to roll over the next 30 days and only a madman/lender would do so, so expect the commercial paper market to continue to implode and along with it many other markets. Both are front and center when we view the next two fingers of instability. Keep in mind that what I outline creates opportunities “Long and Short” in many markets such as currencies, interest rates, stock indexes, commodities, energy, precious metals and more. This is not doom and gloom, these are opportunities so figure out how to turn them into opportunities for your portfolio!!!
Implosions Lower and Explosions Higher!
Tedbits has made some BOLD predictions over the last 60 days and they were belly button moments as I had to decide if I wanted to climb out on a limb with those prognostications. Now it appears that the next 3 to 5 weeks may provide us with a dose of humility or the hubris of accurate tea leaf reading. In the Crack up Boom series, and again just before the “Fingers of Instability” returned, and then during this current series we have outlined our belief that a large stock market pullback would materialize in the 3 rd and 4 th quarter. I believe it has commenced. In the “Crack up boom” I outlined how the markets were far ahead of themselves and needed to CORRECT back to their LONG TERM moving averages.
Over the last 90 days we have detailed the enormous amounts of losses that have been sustained in the “over the counter” derivatives known as CDO's, CMO's, MBS's etc. And have marveled at how few of the losses had been recognized and reported, by the investment and money center banks, and investors in general. They have worked hand in hand with the regulators, main stream media and the respective G7 governments to HIDE the carnage, and they were successful up until LAST WEEK.
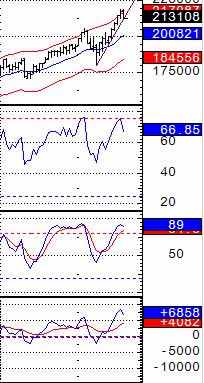
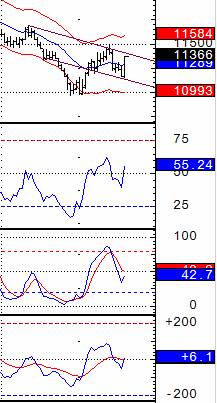
Now, investors are confronted with pricing in the carnage to the value of the big banks, hedge funds and Investment brokers. These “FINANCIAL” segments of the markets represent almost 20 to 25% of the total market caps of the major stock indexes around the world. And as their ability to finance future asset inflation is now in jeopardy. The consumer is out on a limb and liquidity is about to recede, chopping them off at the heels. Rarely do financial markets make V bottoms, usually they make double bottoms to see where the buyers are, we saw a V bottom in August and now I believe we will TEST the lows. If they hold we are off to the races higher, and if they fail a bear market has begun. I am going to lay out a chorus of markets and then come to some conclusions. First we are going on a tour of the major stock indexes around the world on weekly charts:
| Dow Industrials ”Projects Back to the Lows” 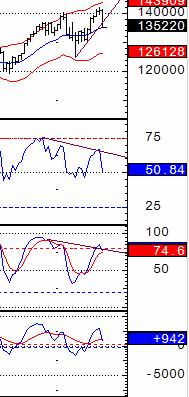 |
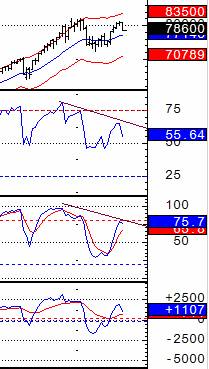
| Investment Banks & Brokers ”Projects Back to the Lows” 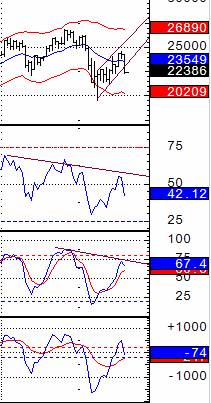 |
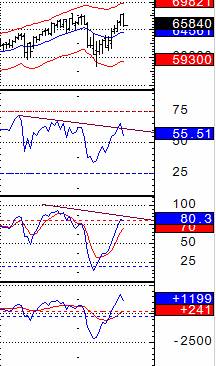
| Philly Banking Index ”New closing lows below August” Pattern projects 10-15% lower 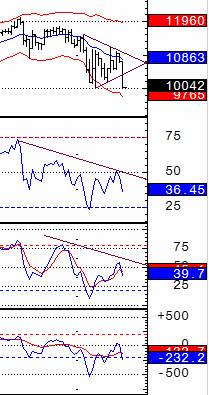 |
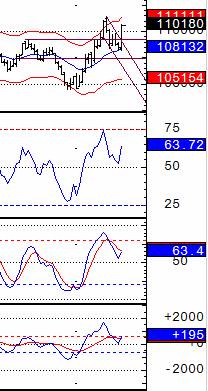
| S&P 500 ”Projects below the lows” 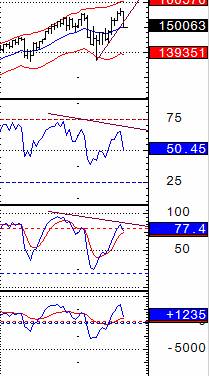 |
NASDAQ - DAX - FTSE 100
It doesn't matter where you look on these charts, double tops, outside down weeks, trend line breaks, bear pennants, outside down weeks, key reversals, bearish divergences all spell trouble. The daily charts on these markets are all in CONFIRMED sell mode and these weeklies are about to confirm those technicals. In Asia the Shanghai , Hong Kong and India 's Sensex markets are parabolic and the public is in at the top and piling in. These emerging markets are all 30% or more above their August lows. One whiff of losses and you can expect a stampede to ensue as they all head for the exits “at the same time”. Those markets could easily move into PANIC mode as the investors are very inexperienced and do not realize the risks they face chasing those markets. The back offices and floors of those exchanges make the 1987 NYSE look positively modern. The bank's balance sheets are about to go into continuous vaporization with the SIV and conduit losses. Hundreds of billions of dollars of losses have yet to be announced by the holders of the sub prime waste.
Now let's look at interest rates in the G7 as they are an echo of the tops we see here -- they are signaling powerful bottoms:
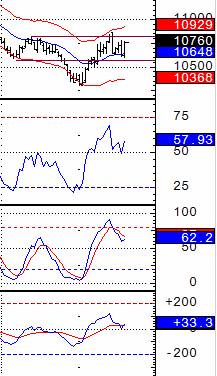
US 10-year Notes - German 10-year Bunds - UK 10-year Gilts
WOW, these markets look like mirrors of one another don't they? All sporting reverse head and shoulder bottoms and approaching buy signals on the weekly charts, if you look carefully at the right shoulders, key reversals, MACD buy signals and double bottoms can be seen as well. Slow stochastic buy signals should confirm soon. Signaling the flight to quality and the re-flation needed to underpin the coming deflation of the stock markets and the financial and banking sectors in particular. Remember, these charts run through all of 2007 and are weekly bars, so these are intermediate term patterns. The daily charts are all on solid buy signals with double bottom patterns clearly active projecting moves higher (i.e. lower interest rates).
All time frames of sovereign interest rates rallied fiendishly all week, 30. 90 and 180 day T bills, 2, 5, 10 year notes, gilts, bunds, bobl's and 30-year bonds joined in a unanimous chorus signaling broad fires in the private credit markets and G7 financial sectors. Flights to quality are clearly evident, and of course this means regular lending is being reduced. Easier rates and re-flation through CUBIC fiat money creation to fight the fires in the asset markets is firmly in place and set to accelerate. Commodities are strong and near their highs. Can you say STAGFLATION?
These patterns signal serious weakness in the stock markets of the G7 and rallies in interest rates (lower rates) as financial authorities and the markets aggressively price in the easing of monetary conditions to support economic activity.
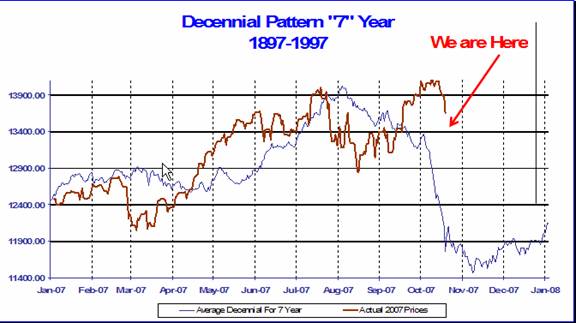
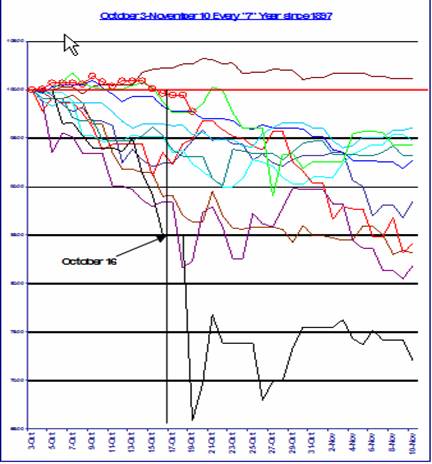
Now we are going to update the 100 year patterns of the years ending in 7 going back to 1897. This work has been done by Peter Eliades of www.Stockmarketcycles.com . Peter is truly one of the senior statesmen of the technical analysts. I began my career watching Peter on FNN (financial new network) in the early 1980's, go there and subscribe. He has done some extraordinary work for many years and he generously is sharing it with you. The fingerprints of the recent highs have been an echo of mid July in terms of the internal structures. We have been seeing a number of “Hindenburg” omens over the last several weeks and Friday put the finishing touch on a “Titanic” signal as well. This is exactly what took place in mid July . Let's first look at Peter's comments from his October 16 th daily update:
All of a sudden, it's beginning to look a lot like July of this year. Today, just a few days after the Dow registered new all-time highs, the number of 52 week lows on the New York Stock Exchange exceeded the number of 52 week highs. The lesser of 52 week highs and 52 week lows was greater than 2.2% of the number of total issues traded on the New York Stock Exchange generating a Hindenburg Omen. Not only that, but another Titanic Syndrome danger signal could be given as soon as tomorrow if declining issues on the New York Stock Exchange outnumber advancing issues. In fact, such a signal will be given if there is a greater than 1.75-1 negative advance/decline ratio either tomorrow or Thursday. Our Los Angeles colleague, Bill Ohama, devised the Titanic Syndrome signal a few decades back and as we noted in our update on July 18th of this year, Dennis Myers updated the rules for this indicator to account for the far greater number of issues being traded today than were traded when the indicator was first devised. Let's give you the rules for the Titanic Syndrome that we originally included in our July 18th update:
• The Dow must first make a new 52 week high.
• Within 7 days before or after the 52 week high new lows must exceed new highs.
• After the 52 week high, for any 2 consecutive days, there must be a greater than 2-1-advance/decline day, and one of those days must have declining issues greater than or equal to 5 times advancing issues.
• After the 52 week high in any 3 days out of a 4 day period declining issues must be greater than or equal to 1.75 times advancing issues in each of the 3 days.
• After the 52 week high declining volume must be greater than 9 times advancing volume.
The first two rules have been satisfied and, as noted above, the fourth rule is close to being satisfied already. Only one of the last three rules has to be satisfied to complete the signal. With that knowledge, you can follow the indicator along with us.
We were somewhat surprised today after entering the recent data into a spreadsheet to find that the market has not deviated significantly as yet from the very negative pattern in evidence for the past 11 decades during October and early November of years ending in 7. In fact, today's price relative to the October 3rd close is below the results of three of the prior 11 decades traced in our most recent newsletter on the page 3 chart.
As to the overall decennial pattern chart for years ending in the digit 7, if the Dow were at its average price today based on the closing price on the last market day in the year 2006, it would be at the 12,296 level. That is not necessarily a prediction but it could give us an idea of the downside potential over the next month or so if the market decided to pursue the prior patterns of years ending in the digit 7
On Friday Peter confirmed that the last condition was met for a Titanic signal, here's what he writes:
Well! Now it's beginning to look a lot more like October of a year ending in the digit 7.
Let's begin with a technical indicator we mentioned on October 16th, namely the Titanic Syndrome, invented by Bill Ohama. At that time, we noted that the first two requirements for generating a signal had been met and all that was required to complete the signal was one of the remaining three conditions. We were close to seeing condition #3 met over the past 2-3 days, but the market did not generate three out of four days with a negative advance/decline ratio greater than 1.75 to one. Today, however, saw a day in which declining volume swamped advancing volume by a ratio of 27.7-1. The requirement for condition #5 is a negative ratio greater than 9-1 so today easily qualified and the signal has now been completed. Dennis Meyers wrote an article for Stocks And Commodities magazine in 1995 and updated the original Ohama parameters to the ones given in our October 16th update. In that article, Meyers examined the signals given over the preceding 17 years and it turns out, by our calculations from his article, that the average decline from the closing price on the Dow on the day of the confirmed signal to the following low closing price was 7.9%. There were obviously noticeable variations in the results and we have not followed through with the results over the past 12-13 years.
We now have seen both a confirmed Hindenburg Omen signal and a confirmed Titanic Syndrome signal so it would be fair to say that the market is in a weakened technical condition.
Peter was kind enough to update his charts of years ending in 7 going back to 1897 and continuation charts for years ending in eight through last week:
Now let's look at how the pattern looks going into next year:
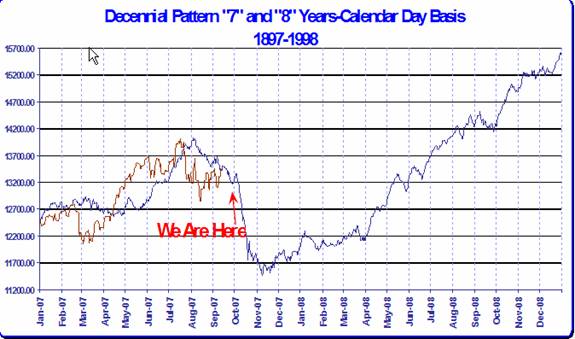
Actually looks like a great buying opportunity once the re-pricing of risk and the pricing in of the losses by the investment communities are completed. The Zimbabwe-zation of the world's currencies will resume at that time. Then Peter did another look at it, year by year, with an overlay of 2007:
Thank you Peter. Peter can be reached at www.Stockmarketcycles.com . As you know I have been negative on the stock markets until the dirty laundry is aired by the investment and banking communities around the world. I still am. This is just an opportunity for prepared investors, is this an opportunity for you or a pitfall? If it is the latter you need to work hard on diversifying your portfolio into investment vehicles which can have the potential to put you on the right side of the markets, whichever way they choose to go: “up, down or sideways.
Deadbeats
The G7, World Bank and IMF meetings have just taken place, and two things were plainly evident. They like to blame China for all their POLICY failings in regard to creating the ingredients for wealth creation and inability to compete in the global marketplace. Higher taxes, redistribution of wealth from the productive to the government, endless regulations and money printing will do that to you. And that they are increasingly shrill in view of the prospect of repatriation (G7 currency holders wanting to spend their money) of their IOU's from their suppliers.
Sovereign wealth funds were front and center as the latest FOREIGN DEVILS were trying to undermine the peace and prosperity of the G7 WELFARE STATES. The G7 have PRINTED TRILLIONS OF EURO'S, POUNDS, YEN and DOLLARS and shipped them as payment for all sorts of purchases. Now those “foreign devils” expect to be allowed to spend them. But since their (G7) currencies are no longer money backed by gold, silver or anything but public servant empty promises, they are now actually receipts for future payments -- in other words, IOU's. Repatriation is an ugly thought to these fraudsters, when their emerging world and energy suppliers come to town to spend their money. Sooner or later their constituencies will begin to understand that their futures have been sold. Share croppers and they don't even know it yet.
The Chinese sent a minor financial official signifying the level of their respect for these freeloaders, former financial hegemon's and socialists. What a laugh as the emerging world gives the capitalist world a lesson in saving, capitalism and wealth creation. Take a look at this chart of G7 GDP over the last thirty years, a clear head and shoulders top pattern is in place and active:
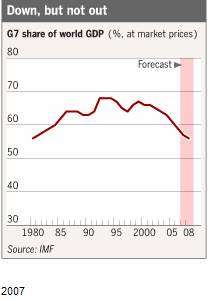 These G7 guys are about to become yesterday's news as their creditors around the world are about to impose NEW terms for their borrowing. Notice how the percentage of world GDP in the G7 is back to levels not seen since 1980? All the growth since that period has been lost, meantime stocks are on their highs. What's wrong with this picture? What were the G7 economies like in 1980? High inflation, no growth, oil at all time highs, dead ends for entrepreneurs, punishment for taking risks and investing, and mired in regulatory and tax quagmires on all levels? Does that have a familiar ring to the REALITY of the G7 economies today? YES. The US dollars term as reserve currency to the world is about to undergo a review by the credit committee.
I don't believe they will like what they find. Just as the floundering US needs increasing exports to capitalize on the weak dollar to fuel the economy, the Mandarins in Washington DC are moving steadily to kill those export markets with “IMPORT' tariffs and domestic wealth-destroying taxes, steadily increasing employer mandates and regulations. To the public servants of the G7, that's ok. As long as they have their trusty printing presses they can just print the money and steal their constituent's wealth at night while it sits in the bank, as they always have. If their economies can't earn money thay can print some. This increasing impoverishment pushes the dumbest among their constituents right into their populist hands.
In closing,
The next several weeks look chaotic at the least. The commercial paper markets suffered a withering blow last Friday afternoon when the commercial paper of two SIV's was basically declared into default. The huge move higher (lower rates) across the government yield curve signaled this event, so we can see some people had advance knowledge of this. It appears the master liquidity enhancement “Garbage collector” SIV to the SIV's covered last week may be too little too late, as in the next 30 days huge amounts of paper must roll. And because of last Friday's defaults the odds of doing so is “slim to none”. The “private” credit markets resumed their meltdown last week, so funding is going to become increasingly scarce unless you are a government. In that case you are in a bull market as there is more demand then supply. Remember the chart of treasuries versus junk from several weeks ago and my comments of going there like a laser beam?
Marc Faber and Julian Robertson appeared on CNBC this week and did what is rarely allowed in the main stream financial press, they talked about the money printing.
The commodities markets have remained firm and probably will do so except on stock market crash days. Hindenburg Omens and Titanic Signals, years ending in 7 going back to 1897, credit market meltdowns (commercial paper) and melt ups (government treasuries), crumbling AAA, AA, A rated investments, all point to trouble dead ahead. The action in the dollar this week projects a “longer term” move to 62 from its present level at about 78, A 20% move lower signals the equivalent loss in purchasing power . No nation has ever devalued their currency to prosperity and the US government won't accomplish this task either. ANYONE GOT GOLD?
The public servants in Washington, statehouses, municipalities and on the campaign trail throughout the G7 believe they can institute the policies of Michigan (high and rising taxes, runaway spending and new “entitlements”, destruction of private education substituted with public education, runaway regulations and state mandates for employers) and somehow they think the outcome will be different. The result will be the same: stagflation and recession is front and center in the United States , G7 on all levels of the economy.
Tedbits is not “DOOM AND GLOOM”, we are optimists, but in order to be optimistic you need to be prepared to meet the world as it unfolds and blossom because you have set your investment sails properly. It is reality, not spin and main stream media, for successful portfolios you must learn how to BENEFIT from them (Tedbits). These issues will move lots of markets(up and down): Stocks, Interest rates, Currencies, Commodities, Precious metals, Raw materials, Grains, Energy, just to name a few. Those moves are creating BIG OPPORTUNITIES! And they are in their infancy. The G7 government and financial authority's prescription for the upcoming turmoil is predictable: They will “print the money”.
We are not sweating this, ARE YOU? We have prepared for these opportunities, have you? These are opportunities for prepared and properly diversified investors, if these are pitfalls you obviously are not properly diversified. Study what you need to do and become so. Find things you can be comfortable with and implement them! Thank you for reading Tedbits and the “Fingers of Instability” series. If you enjoyed it send it to a friend or subscribe its free at www.TraderView.com . , don't miss the next installment of “Fingers of Instability”.
Ty Andros & Tedbits LIVE on web TV. Don't miss Ty interviewed live by Michael Yorba from Commodity Classics every week discussing this week's commentary and unfolding news. Catch the show every Wednesday at www.MN1.com or www.CommodityClassics.com at 4:15pm Ce ntral Standard Time . Archived video casts are available there as well.
If you enjoyed this edition of Tedbits then subscribe – it's free , and we ask you to send it to a friend and visit our archives for additional insights from previous editions, lively thoughts, and our guest commentaries. Tedbits is a weekly publication.
By Ty Andros
TraderView
Copyright © 2007 Ty Andros
Hi, my name is Ty Andros and I would like the chance to show you how to capture the opportunities discussed in this commentary. Click here and I will prepare a complimentary, no-obligation, custom-tailored set of portfolio recommendations designed to specifically meet your investment needs . Thank you. Ty can be reached at: tyandros@TraderView.com or at +1.312.338.7800
Tedbits is authored by Theodore "Ty" Andros , and is registered with TraderView, a registered CTA (Commodity Trading Advisor) and Global Asset Advisors (Introducing Broker). TraderView is a managed futures and alternative investment boutique. Mr. Andros began his commodity career in the early 1980's and became a managed futures specialist beginning in 1985. Mr. Andros duties include marketing, sales, and portfolio selection and monitoring, customer relations and all aspects required in building a successful managed futures and alternative investment brokerage service. Mr. Andros attended the University of San Di ego , and the University of Miami , majoring in Marketing, Economics and Business Administration. He began his career as a broker in 1983, and has worked his way to the creation of TraderView. Mr. Andros is active in Economic analysis and brings this information and analysis to his clients on a regular basis, creating investment portfolios designed to capture these unfolding opportunities as the emerge. Ty prides himself on his personal preparation for the markets as they unfold and his ability to take this information and build professionally managed portfolios. Developing a loyal clientele.
Disclaimer - This report may include information obtained from sources believed to be reliable and accurate as of the date of this publication, but no independent verification has been made to ensure its accuracy or completeness. Opinions expressed are subject to change without notice. This report is not a request to engage in any transaction involving the purchase or sale of futures contracts or options on futures. There is a substantial risk of loss associated with trading futures, foreign exchange, and options on futures. This letter is not intended as investment advice, and its use in any respect is entirely the responsibility of the user. Past performance is never a guarantee of future results.
Ty Andros Archive |
© 2005-2022 http://www.MarketOracle.co.uk - The Market Oracle is a FREE Daily Financial Markets Analysis & Forecasting online publication.