Gold Bull Market set to resume
Commodities / Forecasts & Technical Analysis Jan 21, 2007 - 11:15 PM GMTBy: Nadeem_Walayat
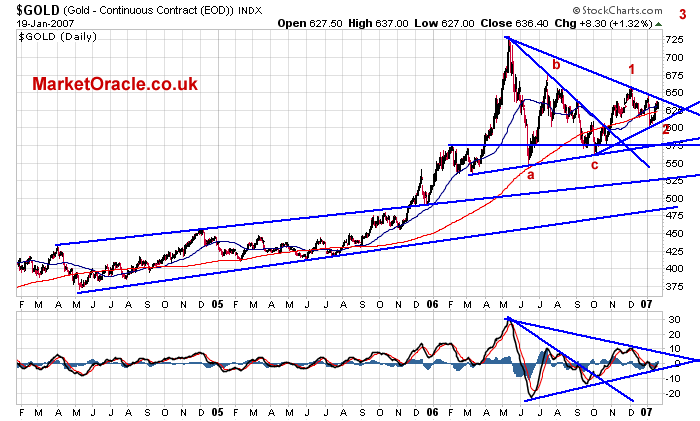
 Gold has been in a corrective pattern since the May 2006 peak, attempting to build a base in anticipation of the resumption of the bull market. Now finally, Gold appears ready to resume the up trend with clear technical indicators signaling a breakout is imminent.

Technical Analysis
- Price Patterns - The price pattern being played out by Gold since the May 06 highs is that of a symmetrical triangle, which usually breaks in favour of the preceding trend which in this case is higher.
- Resistance - The up channel line is containing the up trend.
- Support - Immediate support lies below the last low (2) at 600. Major support is at 560. though 600 is expected to hold any immediate correction.
- MACD - (Bottom indicator) - The MACD is also in a symmetrical triangle, though in a neutral state, which suggests a break higher in gold could carry someway before the metal next reaches an overbought state.
- Elliott Waves - The basic elliott wave pattern suggests an ABC correction which bottomed in October 2006, and subsequent price action supports the start of a new leg higher for GOLD in the forms of Wave 1 UP, and the corrective Wave 2 down. So the elliott wave pattern supports other TA as it should be used as a secondary indicator rather a primary indicator of trend.
- % Levels - The symmetrical triangle pattern measures 190 points and therefore key %'s are : 50% = 635, Current resistance, 61.8% = 657. Peak of Wave 1. 100% = 730, May peak, 150% = 825, - 1st Target, 161.8% =847 - 2nd Target. 200% = 920 - 3rd Target.
- Up trend Line - .The key support trendline is along the A and C lows. The current correction as identified by wave 2 failed to get anywhere near this support trendline, which is a sign of strength
- Inter-market Analysis - What's not gone unnoticed is gold's relative strength in the face of breakdowns in other metals and commodities such as copper and crude oil. Thus suggests strong support for gold during the correction in anticipation of the resumption of the bull market.
- Time - Gold has now unwound its overbought state, having corrected for 7 months since the peak in May 06, which sets the scene for a substantial rally in terms of time and price.
Conclusion - Gold is looking very bullish as it is about to break out of the symmetrical triangle pattern, with other supporting analysis suggesting this to be imminent. The up trend is likely to carry gold beyond the previous high set in May 06, upwards and onwards towards to 847 and eventually to over 900, targeting 920 this year !
Buy Trigger - The two key buy triggers for Gold are 636 and 658. With gold at 636, it is on the verge of confirming a break of the first trigger. The best position would be a rolling spot contract. Or longer term investors can hold gold directly at bullionvault.com
Target - A break above 658 would target 847.
Stop-Loss - A position at the current price of 636 would require a stop at 600. A break of 658 at 626.
By Nadeem Walayat
(c) MarketOracle.co.uk 2007
Disclaimer - This Forecast / Trade Scenerio is provided for general information purposes only and not a solicitation or recommendation to enter into any market position, and you are reminded to seek independent professional advice before entering into any investments or trading positions.
The Market Oracle is a FREE Financial Markets Forecasting & Analysis online publication. We aim to cut through the noise cluttering traditional sources of market analysis and get to the key points of where the markets are at and where they are expected to move to next ! http://www.marketoracle.co.uk
This article maybe reproduced if reprinted in its entirety with links to http://www.marketoracle.co.uk
© 2005-2022 http://www.MarketOracle.co.uk - The Market Oracle is a FREE Daily Financial Markets Analysis & Forecasting online publication.


