


Stock Market Analysis Suggests a Drop of More than 10% - The Fingers of Instability, Part 8
Stock-Markets / US Stock Markets Oct 10, 2007 - 09:33 AM GMTBy: Ty_Andros

Series Introduction – Click Here
 Tea Leaves
In this edition of Fingers of Instability we are going to look at the last ninety days since the July Highs in stocks and commodities and look at what the numerous markets, including money supply, credit markets, stocks, gold, copper crude oil, and the dollar, have done since that time. It offers an interesting perspective on what has transpired and the finger prints of what we can expect in the near future. This issue has many interesting charts and graphs for perspective. However, we must key off money and credit creation first and foremost as it colors everything else. Regular readers know I have outlined the emerging “Crack up Boom” (see Tedbit archives at www.TraderView.com ) and the indirect exchange, as outlined by Ludwig Von Mises, that we will be seeing for maybe the next decade or more. It is on plain display in this missive.
For greater insight into our publication, have a look at the Overview of Tedbits . It helps current and potential subscribers understand our mission in serving you. It also gives a broad description of what's unfolding globally and what you can expect from Tedbits as a regular reader.
There is no shortage of money and the “Crack up Boom” (see Tedbit archives ) is front and center for the next 5 to 10 years, at least. Volatility is opportunity for the prepared investor, after years of low volatility we are now headed to the opposite extreme, so buckle your seatbelts and prosper. Are you prepared to be a winner and benefit, or a loser to be one of the victims of those who have done their homework and positioned the sails of their investments to thrive in the upcoming turbulence?
Money Supply
Hundreds of billions of Dollars, Euros, Yen, British Pounds have been injected into the banking systems as central banks and treasury officials try and underpin the loss of confidence caused by the financial “Alchemists” that created and distributed the OVER-THE-COUNTER derivatives known as CDO's, CLO's, MBS, (collateralized debt obligations, loan obligations, mortgage backed securities,) etc. These investment products were manufactured by the masters of the world at the big money central banks and investment banks.
These products were created in conjunction with the ratings agencies such as Standards and Poor's, Moody's, and others who were paid big fees so the distributors of the investment products could package and sell these securitized products to the savers of the world. In putting very bad lending decisions into these products, the banks were able to do what ancient alchemists tried to accomplish, turning lead into gold. The biggest dumb money in the world bought the labels based upon their FAITH in the ratings agencies' traditional fiduciary role as impartial judges of investment quality. Junk was sold as gold. Now, confidence in the American capital markets is disintegrating in a rapid manner.
These securities are illiquid, opaque, quant driven bombshells and they are spread out around the world, hiding in portfolios, and we are waiting for the holders of these products to recognize their losses so we can see the extent of the damage to the world's financial systems. We are going to look at the US today and what you will see is mirrored around the world in the G7 financial systems.
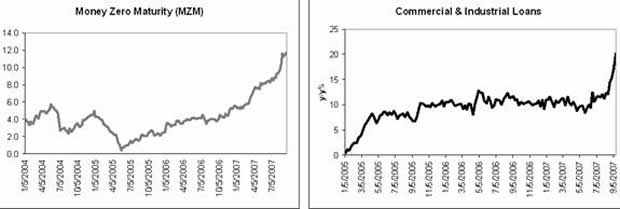
Wow, Look at the last two years which have seen a fairly stable rate of growth. Now it shows money with zero maturity SKYROCKETING (growing at a 21% rate in the last 2 months), M2 is growing over 22% on a year-over-year basis and reconstructed M3 is approximately 15%, the financial authorities are pouring money on the financial fires. Murdering the middle class as their money is attacked at night by fiat money and credit creation which will further mega inflation in everyday goods emerging on the near horizon as the central banks try and underpin the financial sectors as they undergo major bouts of deflation (vaporization of the value of these unappreciable securities) of the value of their holdings. Commercial and industrial loans have skyrocketed as well, as banks have been forced to take the loans -- which used to be financed through the commercial paper and money market funds, that have now fallen back -- into their balance sheets. Now let's look at the commercial paper markets which have collapsed due to lenders withdrawing because the VALUE of the securitized derivatives used as collateral is unknowable.
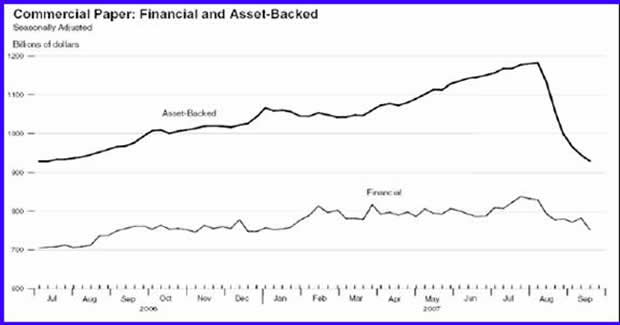
The financial community has had a dose of reality imposed on them by their lenders/customers as their products can no longer be financed and sold. These charts can only be called a crash in confidence by the lenders/savers of the world. They are recoiling from these instruments and are in a flight to quality, as we can see from this next chart of money market funds:
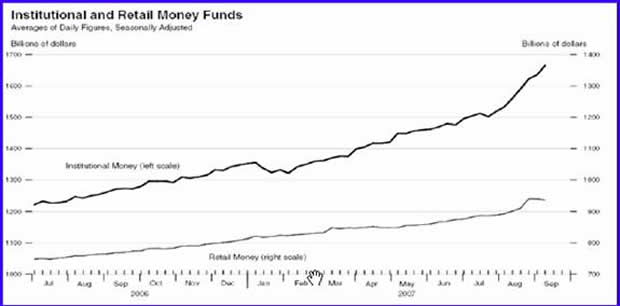
…which are skyrocketing as well! Another outlet for this exodus, as we will see in one the next segments, is a narrow group of stocks which are masking stock market problems. Make no mistake, there is plenty of money out there, over 2.8 trillion dollars in money markets alone, it's just fleeing the securitized sectors of the markets.
Additionally, M&A and bank lending are collapsing throughout the G7 as the banks are now raising lending standards and good credit risks are victims of previous poor ones. The Financial Times reports:
“Fears that the Euro zone would suffer significant economic fall-out from the global credit squeeze were heightened yesterday after the European Ce ntral Bank reported a sharp slowdown in demand for loans to business and a significant toughening of credit standards applied by banks.
Demand for loans by business was the weakest for two years and a further deterioration was expected in the final months of the year, according to the ECB bank lending survey. The percentage of banks reporting that they had tightened credit conditions over the past three months on loans to business and to people buying houses was the largest since the survey began in early 2003.”
The story in the United States is no different; banks' primary income streams are vaporizing as a result of this. The credit squeeze is far from over and the money printing is only a prelude to future issuance. Reflation is front and center. As dollar holders worldwide see this….
Dollar
The dollar has descended to 30-year lows versus a basket of currencies as illustrated by the following chart:
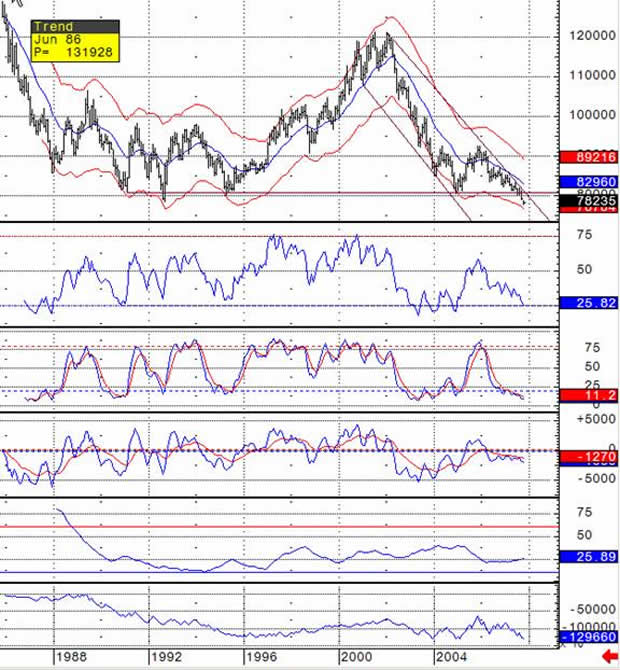
DOLLAR INDEX
This chart illustrates the long-term nature of the breakdown. Look carefully at the bottom chart of on-balance volume. “OUCH”, foreign holders of dollars are fully aware of what the Federal Reserve has decided to do to the dollar: Sacrifice them on the alter of American politicians' money printing, market manipulation, re-election, socialist, trade war and spending plans. This signals the ongoing long-term demise of the US dollar as the reserve currency of the world and the emergence of new capital repositories over the coming decade….
Gold, Copper, Crude and the CRB
As the paper solutions to the problems of Wall Street and the Money center banks are being created, Gold is the beneficiary of their hubris. Gold, a long time manipulated market as central banks attempt to kill the canary in the coalmine of their profligate money and credit creation to underpin the asset-backed economic plans they have chosen to embrace, has now broken out to the upside from an 14 month consolidation pattern:
GOLD
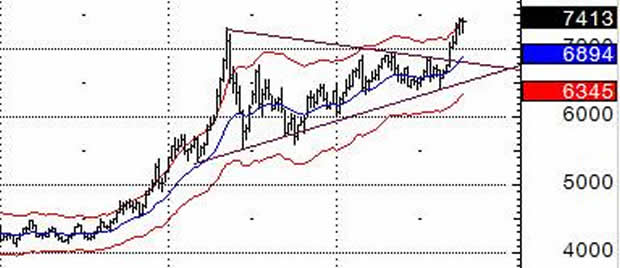
This chart projects gold to rise approximately 190 dollars higher from the point of the breakout. This breakout can be seen in terms of every currency in the world. The gold cartel has tried mightily to cap the price of gold and maintain the illusion of low inflation. Take a look at the incredible amount of shorting that has taken place over the last 7 weeks on Gold.
Here's a quote from a recent Richard Russell “Dow Theory Letters”, www.dowtheoryletters.com :
“The whack on the chin that gold received today is strictly technical, brought on by the steady shorting of the Commercials (gold mines and gold banks). Heavy shorting increases the supply. Here's what the shorting of gold contracts looks like over recent weeks.
8/28 -- 195,541 gold contracts sold short by the Commercials.
9/04 -- 207,800 " " "
9/11 -- 244,914 " " "
9/18 -- 294,440 " " "
9/25 -- 296,413 " " "
 The weight of this shorting ultimately had to topple gold -- but only temporarily. After shorting, if gold continues to rise, the Commercials simply increase their shorts. The mines can always supply the gold if the price continues higher. If the price of gold declines, the mines can take the profits on their short sales. It's a game and it's played over and over again. And, of course, the Fed and the US government love it because rising gold is a red flag for the Fed. You see, rising gold tells the public that inflation is heating up.” Thanks Richard.
After this was written, the gold cartel was able to hit gold hard for a pullback of about $25 dollars from recent highs. But fierce buyers emerged at the price of $726; at one point, gold was down over twelve dollars that day and finished up over eight. Volume was HEAVY as this reversal back to the recent highs commenced. These Commercials are heavily underwater and dollar holders everywhere are anxious to exchange FAKE money, aka US dollars and all fiat currencies, for real money known as GOLD. They are buying every pullback. It is a war as dollar and fiat currency holders everywhere challenge the money printing abilities of central bank proxies on the floors of the major exchanges where prices are settled in “PAPER”. This is prima facie evidence of the indirect exchange unfolding in the emerging “CRACK UP BOOM” (see Tedbit archives at www.TraderView.com ).
Wonder why these GOLD banks/companies are fighting a rise in the value of their holdings? They have become the proxies of the central banks' attempts to strangle gold's rise so their money printing activities are not full displayed to the public
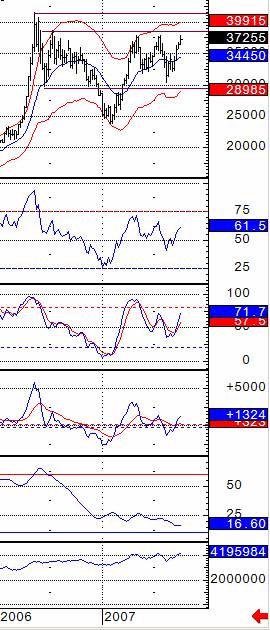
Copper is about to break to the upside as the emerging economies are BOOMING and the required copper to do so is enormous. Take a look at this GIANT inverse head and shoulders bottom on the weekly charts signaling the next leg up in copper to over $5.50 cents a pound, once it breaks the highs as denoted:
This is a weekly chart and the head and shoulder bottom pattern that has developed over the last year signals a booming world economy. Note the buy signals in the slow stochastic's and MACD studies. ADX volatility is low signifying “LOOK FOR PATTERNS”, and on balance volume is brisk to say the least. As they say the trend is your friend and in gold and copper they are alive and well. Now let's look at some technical analysis of crude and some of the fundamentals underpinning the move above:
COPPER
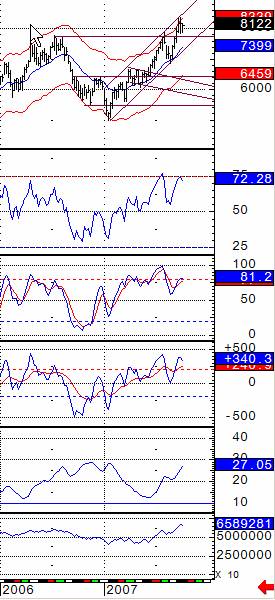
This chart is basically the same as gold and copper 14 month consolidation patterns with solid breakouts higher. Trend, momentum, RSI, on balance volume all say up, up and away. There are 3 patterns easily seen: A head and shoulder bottom at 50 dollars; A brief pullback as crude tested the old highs and projects oil 8 dollars higher short term;
And the longer-term pattern which projects to close to $100 dollars in the intermediate term. Worldwide oil is in backwardization and stockpiles are shrinking -- it doesn't pay to store it, in fact, you are penalized for it so they aren't. The commodity indexes such as the CRB, BIRMI, and GSCI are shooting to new highs regularly as demand continues to emerge and currencies continue to DEFLATE in value.
THERE IS PLENTY OF LIQUIDITY and it is seeking shelter from the printing presses and opportunities presented by the demand of the booming global economy. It no longer wishes to invest in the over-the-counter derivative trash.
![[Shrinking Stockpiles]](../images/Ty_Andros_10_10_07_image015.gif) CRUDE OIL
CRUDE OIL
Stocks
As many regular readers know, I have been short-term bearish on the stock market, looking at a minimum retest of the August lows and possibly quite a bit more. This forecast has been problematic, but when you understand the growth in money and credit since the August lows, you will know that the term “they will print the money” has taken on a new and more influential role in how we view recent market action. But first let's take a look at the markets. As the money supply growth would portend “they have soared”! But if you look at volume and breath, this is a rally of very poor quality. It has been confined to a group of big names so let's look at a chart of the Russell 2000 with breath figures:
CRUDE OIL
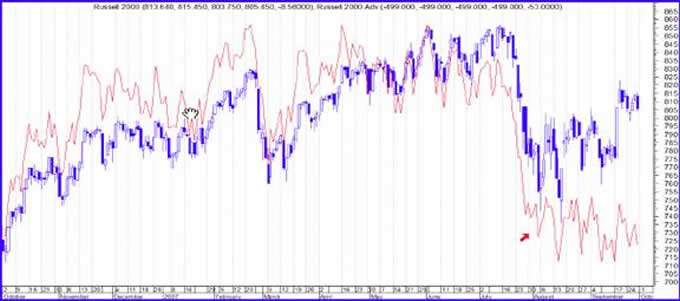
This shows how narrow the rally has been. It has been concentrated in a small group of big names that have lead the headline numbers higher, can you say “the president's working group on markets”, commonly known as the plunge protection team? It doesn't matter which stock index you wish to view, all have rallied on poor breath and volume. Transports, semiconductors, and myriad other indicators illustrate the narrowness of the rally and refuse to confirm these HEADLINE prices we are seeing. Can you say “bull trap?”
Now let's review a chart of years ending in 7 (this is an analog of all the years ending in 7 since 1897) from a previous Tedbits provided by Peter Eliades of www.stockmarketcycles.com :
Take note: This chart was created in early July, so the “We are Here” no longer applies (although looking back we can see the top came in a week early on July 19 th . Remember, this is an analog of 12 decades of price action). Notice where we are now, early October. This is nut-cutting time. The markets have been slipped a Mickey by the central banks which are printing like the madmen they really are. Here's a quote from a recent daily update from peter:
“We are fast approaching October 3rd in a year ending in the digit 7. Suffice it to say that the average decline between October 3rd and November 8th of years ending in the digit 7 since 1897 is 14.2% on a closing basis. What a remarkable statistic! Of the 11 previous years ending in the digit 7, there was only one year that saw an advance between those two dates and the advance was a tepid 1.7% in 1947. The declines between those two dates have been -13.2%, -16.2%, -17.9%, -3.9%, -19.5%, -6.6%, -7.8%, -3.6%, -25.8%, and -5.6%. We don't know what else to tell you about those remarkable data.”
Peter also did an analysis of the days on which the declines commenced:
“In today's newsletter, we itemize the date of the high closing price for October in each of the 11 previous years ending in the digit 7. Let's repeat them for you here:
1897 October 4th
1907 October 1st
1917 October 1st
1927 October 3rd
1937 October 2nd
1947 October 20th (this was the only year that was up over the stated span)
1957 October 3rd
1967 October 9th
1977 October 1st
1987 October 2nd
1997 October 7th
Over 50% of those closing highs for the month of October within the years ending in 7 occurred in the first two trading days of the month (the 1927 high on October 3rd was the second trading day of that month). After today's rally, you might think that there is no chance for that to occur this year.”
And look at this last little Gem of Peter's: a 54-month pattern identifying tops and bottoms going back through the last 14 years:
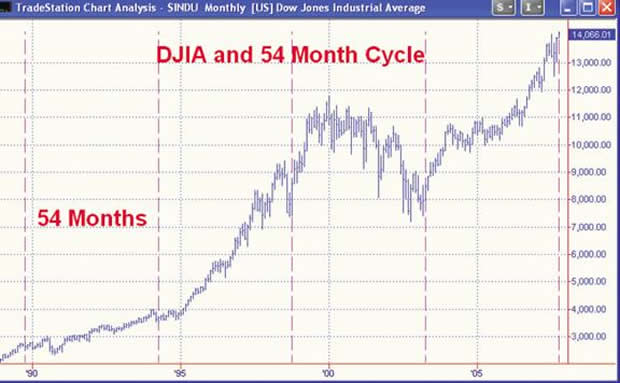
We wish to thank Peter again for allowing us to see his work, he is one of the preeminent cycles analysts in the world and his work is available to you through his newsletter at www.stockmarketcycles.com . Go there and subscribe…
One reason why I have been so bearish is that the financials and banks are over 20% of the market caps of many indexes and I expected heavy losses to be reported. Well, I can only say after seeing the reports that deception is alive and well in the financial capitals of the world as they covered up their losses with smoke and mirrors and fed the public BULL****! Take a look at these announced write-offs of some of the biggest players:
![[Subprime Hits]](../images/Ty_Andros_10_10_07_image022.gif) This is only 18 billion dollars of losses that have been announced and there are over 300 billion dollars of losses on sub-prime ALONE, so the uncertainty of where they are hidden is still in front of us. The money center and investment banks are now virtual Pandora's boxes of coming surprises. We are just waiting for their books to be opened and see what POPS out! It won't be pleasant. The cover up of losses is an ATTEMPT to restart the securitization engines, preserve their capital bases by stock market valuations, recapture their previous gluttonous revenue streams and somehow recover the value of their existing “warehoused” loan inventory, if the market can continue to recover.
This is only 18 billion dollars of losses that have been announced and there are over 300 billion dollars of losses on sub-prime ALONE, so the uncertainty of where they are hidden is still in front of us. The money center and investment banks are now virtual Pandora's boxes of coming surprises. We are just waiting for their books to be opened and see what POPS out! It won't be pleasant. The cover up of losses is an ATTEMPT to restart the securitization engines, preserve their capital bases by stock market valuations, recapture their previous gluttonous revenue streams and somehow recover the value of their existing “warehoused” loan inventory, if the market can continue to recover.
Unfortunately for them, worldwide confidence in their veracity, personal and professional honesty and reliability as capital products originators has been seriously impaired!
Understand this, Goldman Sachs will never under perform. They virtually own the G7 financial authorities through employee migration from their executive suites into the halls of government and power. It undoubtedly is part of their business plan. Just this week a Goldman Sachs alumni and “GRANDEE” was named the head of the Bank of Canada. It is no different in any G7 country: Rise to the top at Goldman regionally, retire when appointed to senior government financial posts and hold onto your options and stocks as the company profits soar through government water carrying. They are also the primary proxy for implementing central bank market operations – it's great work if you can get it. Think about it as these are the obvious terms: Intervene for us and if you lose we pay (government treasury and central banks), if you win “KEEP IT”.
Let's take a look from an excerpt from the original “Fingers of Instability” series from last Marc h as we are now seeing what was outlined at that time:
But the sloshing of that and previous episodes of fiat money and credit injections over the last 50 years are imprecise; they are either going too far or not far enough in money and credit creation. Now we are seeing the mother of all waves, with never-before-seen profits as a percentage of GDP, but it is now oscillating in the other direction. And…
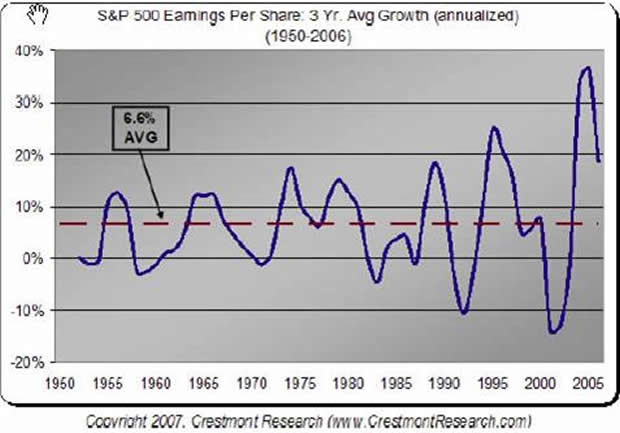
We are in a Wolf Wave and the amplification of each wave up or down is expanding. A chart of a Wolf Wave looks like a megaphone, small on one end amplifying out. Wolves attack and eat things and it is no different with economies and asset markets, they are eaten when a wolf appears. A good example of a Wolf Wave is from John Maudlin's latest letter and by extension Crestmont Research, here he shows corporate profits since 1950 (John can be reached at john @
See the megaphone formation? It is called a Wolf Wave. We are at a fairly good level of profits now. But it projects a nuclear winter in corporate profits dead ahead (see chart below). From Record highs never seen in fifty years, to record lows also not seen in the same period, below the lows of 2001-2002. This chart is a testament to how fiat money and credit creation has made steady growth and economic stewardship become more and more unmanageable over a long period of time. It is clear that monetary policy is also following this Wolf Wave pattern, either too hot or too cold. Politicians (and their “something for nothing” constituents) in the western world see these enormous profits and are set to attack the creators and holders of this wealth, they want the money and will put in place new taxes and entitlement mandates to claw back this gusher of wealth, thereby accelerating the downside of this wave.
We all want business cycles that cleanse past excesses but the up and downs are now out of control, there is no consistency. There is no orderly form to the business and economic cycles, everything now is either booming or busting. This is as frightening a chart as I have seen since the one I used in “Sea Change: The wealth of the world is rotating” (see Tedbits archives at www.traderview.com ), Combine the message of the two charts and commentaries and it signals big trouble in the US, in Europe, then the rest of the world.
Wow, the profit growth has disintegrated just as this chart has predicted in Marc h. Why hasn't this been priced into stocks at this time?
Now let's look at the micro picture of corporate profits: Profit growth, year over year, is collapsing as indicated ![[Rare Decline]](../images/Ty_Andros_10_10_07_image025.gif) by the Wolf Wave. We are now below the average line of 6.6% profit growth and you can expect the acceleration in the collapse of corporate profit growth to continue to below the 2002-2003 lows. Notice the WALL STREET projections for the 4 th quarter? Wishful thinking! Thompson Financial is now predicting 3 rd quarter profits to fall to .8 tenths of 1 percent year over year profit growth for the S&P 500. S&P predicts a 1% year over year drop in profitability, so it's now LOOK OUT BELOW!
by the Wolf Wave. We are now below the average line of 6.6% profit growth and you can expect the acceleration in the collapse of corporate profit growth to continue to below the 2002-2003 lows. Notice the WALL STREET projections for the 4 th quarter? Wishful thinking! Thompson Financial is now predicting 3 rd quarter profits to fall to .8 tenths of 1 percent year over year profit growth for the S&P 500. S&P predicts a 1% year over year drop in profitability, so it's now LOOK OUT BELOW!
Big losses are about to be revealed in the financial sector over the coming quarters and 2,000,000 homeowners are facing resets over the next year. Do you think negative equity in your home, mortgage payments increasing 30 to 70%, and an inability to refinance 2,000,000 homes might be problematic on the economy? Do you think consumer spending is set to skyrocket or be stable in the face of REAL inflation of goods and services and higher mortgage payments? Jumbo mortgage loans priced above the Freddie and Fannie $417,000 dollar limit are almost impossible to get, regardless of the qualifications of the borrower, they are dead! Lopping off bidders in every major city in America and the G7 as properties in those cities never fall below the limit. I believe a repeat of 2001 profit implosions are dead ahead, probably uglier, so it's not going to be such a rare occurrence in the future.
CBOE Put-to-call ratios are back near .50 where they were in MID JULY!, just as the stock market indexes arrive there. Bonds in Germany , the UK , and US have just rolled over and higher long-term rates are front and center as bonds must price in the new money printing dead ahead, can anyone say HIGHER long-term rates, not lower!
But keep in mind, an election year is front and center so the money printing can be expected to increase to create the illusions necessary for RE-ELECTION, no matter what the cost to the purchasing power of the dollar. One need look no further than the current stock market rally that is driven by MONEY PRINTING and easy money in total contradiction to the realities of profit outlooks. The Zimbabwe-fication of the US stock market is unfolding before our very eyes. Or should I say “Crack up Boom”. These NEGATIVE realities WILL be priced into stocks at some point in the future, regardless of the hocus pocus being put forth at this point!
In conclusion, The magicians and illusionists in the G7 financial communities are trying to defend over thirty years of “asset-backed” economic growth as a substitution for the policies of wealth creation. The paper pyramids created over four decades are crumbling and the reflation of them has commenced in SIZE . The bigger the pile of paper that needs to be inflated, the bigger the pile of paper needed to hold it up! This pile of paper is the source of so much illusionary wealth, and the constituents that have built it own, lock stock and barrel, the public servants of the G7.
We are in the era of “STUFF” that can't be printed and is in demand as three billion people enter the industrialized world and doing so with CAPITALISM and Austrian economics.
Commodities and “things you can drop on your foot” are set for continuing rallies. The G7 and US economies can be expected to muddle through as expansion of the money supply does an imitation of the energizer bunny “It just keeps on going”. The assault on capitalism, wealth generation and the socialization of the US and G7 economy continues unabated. Congress is in “show me the money mode.” In other words, yours is set more and more to be theirs. Either through the printing press or higher taxes.
The G7 will succeed in preventing a paper meltdown of depression proportions as they will just “PRINT THE MONEY” as they have amply displayed over the last 90 days. It is obscene to watch. REFLATION and INFLATION is the policy prescription, of the day, week, month, year and decade… It is the solution for any problem in the G7, public servants saying “print the money.”
It's so much easier than devising a “LONG TERM” practical solution that can solve the problems caused by their micromanagement, redistribution and vote buying. We see its fingerprints in the markets we have outlined and I promise you its fingerprints are written in many other markets. Ask yourself, am I going to be a victim of what's unfolding or are these opportunities that I am prepared to catch in my portfolio? If not, why not? Thank you for reading Tedbits, if you enjoyed it send it to a friend and subscribe its free at www.TraderView.com , don't miss the next installment of “Fingers of Instability”
If you enjoyed this edition of Tedbits then subscribe – it's free , and we ask you to send it to a friend and visit our archives for additional insights from previous editions, lively thoughts, and our guest commentaries. Tedbits is a weekly publication.
Ty Andros LIVE on web TV. Don't miss Ty interviewed live by Michael Yorba from Commodity Classics. Catch Ty's interview every Wednesday at www.MN1.com or www.CommodityClassics.com at 4pm Central Standard Time .
By Ty Andros
TraderView
Copyright © 2007 Ty Andros
Hi, my name is Ty Andros and I would like the chance to show you how to capture the opportunities discussed in this commentary. Click here and I will prepare a complimentary, no-obligation, custom-tailored set of portfolio recommendations designed to specifically meet your investment needs . Thank you. Ty can be reached at: tyandros@TraderView.com or at +1.312.338.7800
Tedbits is authored by Theodore "Ty" Andros , and is registered with TraderView, a registered CTA (Commodity Trading Advisor) and Global Asset Advisors (Introducing Broker). TraderView is a managed futures and alternative investment boutique. Mr. Andros began his commodity career in the early 1980's and became a managed futures specialist beginning in 1985. Mr. Andros duties include marketing, sales, and portfolio selection and monitoring, customer relations and all aspects required in building a successful managed futures and alternative investment brokerage service. Mr. Andros attended the University of San Di ego , and the University of Miami , majoring in Marketing, Economics and Business Administration. He began his career as a broker in 1983, and has worked his way to the creation of TraderView. Mr. Andros is active in Economic analysis and brings this information and analysis to his clients on a regular basis, creating investment portfolios designed to capture these unfolding opportunities as the emerge. Ty prides himself on his personal preparation for the markets as they unfold and his ability to take this information and build professionally managed portfolios. Developing a loyal clientele.
Disclaimer - This report may include information obtained from sources believed to be reliable and accurate as of the date of this publication, but no independent verification has been made to ensure its accuracy or completeness. Opinions expressed are subject to change without notice. This report is not a request to engage in any transaction involving the purchase or sale of futures contracts or options on futures. There is a substantial risk of loss associated with trading futures, foreign exchange, and options on futures. This letter is not intended as investment advice, and its use in any respect is entirely the responsibility of the user. Past performance is never a guarantee of future results.
Ty Andros Archive |
© 2005-2022 http://www.MarketOracle.co.uk - The Market Oracle is a FREE Daily Financial Markets Analysis & Forecasting online publication.