The Myth of Debt Deleveraging Deflation
Economics / US Debt Sep 20, 2010 - 08:39 AM GMTBy: Brady_Willett
 Background: The reason the ‘net worth’ data is an important consideration today is self evident: unable to explain why the outlook for consumer spending is positive given that debt service costs are hitting record highs, savings are near record lows, and wages are failing to keep pace with inflation, optimistic economists point to the consumer’s balance sheet and calmly conclude that everything will be all right. And although these analysts have indeed been right for a long time (16-years and counting), there is ample evidence brewing to suggest that the US consumer is about to fall down.. -
August 21, 2007 - Forget Peak Oil, Peak Net Worth is the Real Danger
In the third quarter of 2008 households and non profit organizations (or ‘consumers’) had $14.6 trillion in total debt on their balance sheets. Since then the consumer has managed to reduce this number by a mere $652 billion. By way of contrast, after reaching $79.1 trillion in the third quarter of 2007, total assets have contracted by an astonishing $12.4 trillion.
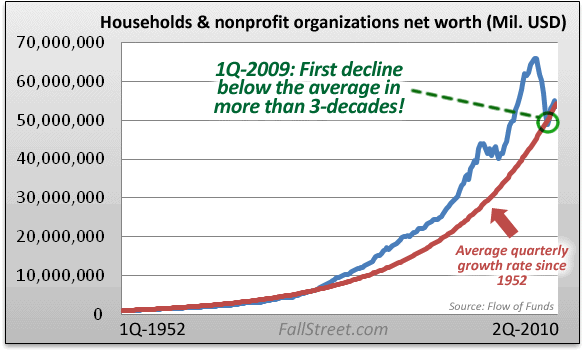
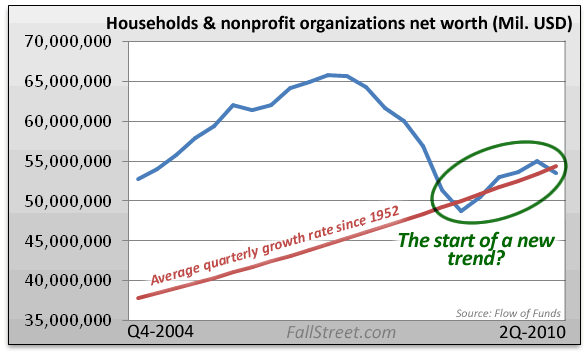
A closer look at the above chart reveals that the net worth of consumers has been close to matching its historical growth rate during the last six-quarters. Should this trend continue, sometime during the second quarter of 2013 the net worth figures will surpass their former high of $65.7 trillion. Needless to say, this type of steady increase in net worth is more sustainable than the skyrocketing/plummeting experiences of yesterday.
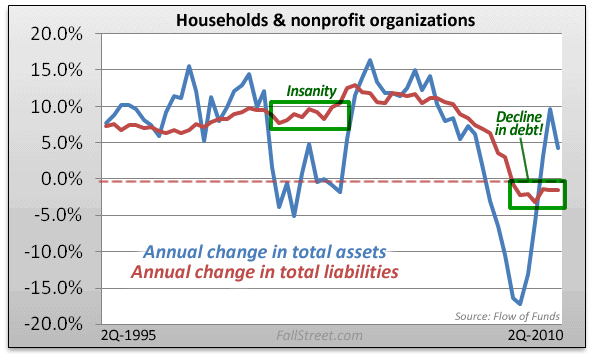
Also noteworthy is that in each of the last 3-quarters total assets have increased on an annualized basis while total liabilities have declined. Despite the fact that liabilities are declining primarily because of defaults (WSJ), this is one of the most significant ‘deleveraging’ trends when it comes to household balance sheets.
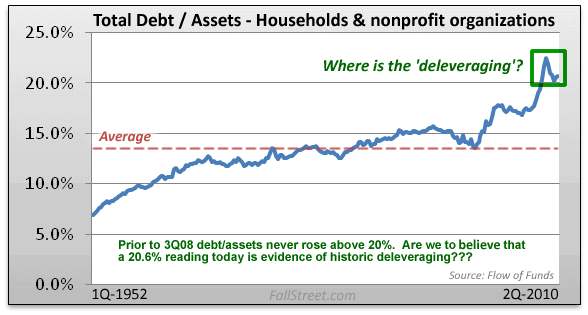
Despite some positive trends on the balance sheet side of things, it is not reasonable to conclude that ‘deleveraging’ has run its course. On the contrary, given that the decline in household assets has been 19-times greater than the decline in liabilities (from each lines respective ‘peak’ until 2Q10), many false positives have been produced in recent quarters. On this front, consider the following:
* Since debt peaked in 3Q08 debt/assets have increased.
* Since assets peaked in 3Q07 debt/assets have increased.
* Since net worth peaked in 2Q07 debt/assets have increased.
In other words, if you ignore the 5-quarters ending 4Q09, debt/asset readings suggest that there has been absolutely no deleveraging of household balance sheets.
To be fair, there are some statistics that support the notion that the consumer is not acting as foolishly as yesterday (see also the Fed’s estimates on debt servicing costs). A couple of charts on this idea will suffice:
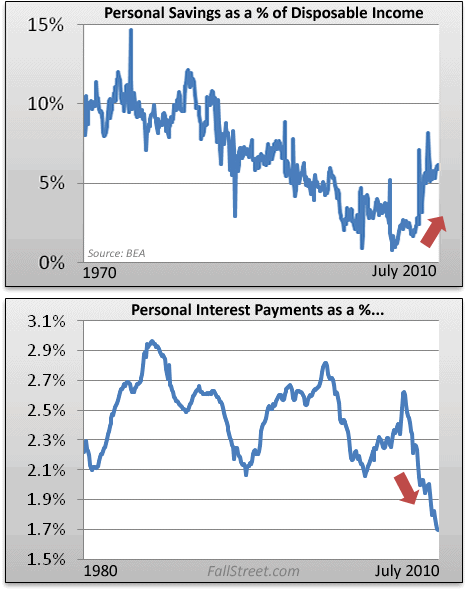
Optimism aside, even though the above statistics tell us that the consumer is saving more money (as opposed to say buying internet stocks or trying to flip real estate), and that the debt servicing costs statistics are going in the right direction, it is worth remembering that a major improvement in household balance sheets has yet to materialize. In other words, consumer has a new shovel in hand, but when will they really start digging?
Conclusions
The U.S. consumer spent more than 2-decades amassing debt at an unsustainable pace, and along the way they embraced an erroneous faith that their investments (or yesterday’s ‘savings’) would always bail them out trouble. Given that this ‘faith’ has been shattered, it is entirely reasonable to conclude that it will an extended period of time before the type of balance sheet leverage seen in recent memory returns (if ever).
Many economists and policy makers do not agree that a prolonged period of balance sheet deleveraging is in the works, and instead speculate that any improvement in household balance sheets is one reason to eye another consumer binge:
“Stronger balance sheets should in turn allow households to increase their spending more rapidly as credit conditions ease and the overall economy improves.” Bernanke
Not only does the consumer have a long way to go before its balance sheet can be considered ‘strong’, but the very idea that deleveraging today produces consumption tomorrow is suspect. Quite frankly, the end result to ‘deleveraging’ may simply be a more sustainable balance sheet rather than a balance sheet ready to support an increase in consumption.
On this point it is worth pointing out that even though a company like Wal-Mart had a debt/assets reading of 59% in 1971 and ended fiscal 2010 with a debt/assets reading of 58%, it still became one of the great growth/profit stories in American history. The lesson, if otherwise unclear, is that assets and liabilities can (and in some cases must) grow in a consistent and sustainable manner to achieve maximum prosperity.
With this in mind, and remembering that household balance sheets are in most respects still extremely levered compared to the historical norm, why are policy makers like Bernanke quick to speculate that a stronger balance sheet can “allow households to increase their spending”? One word answers this question: desperation.
In short, while the means for future deleveraging of household balance sheets exists, it is a complete myth that this process is afoot.
By Brady Willett and Dr. Todd Alway
FallStreet.com
FallStreet.com was launched in January of 2000 with the mandate of providing an alternative opinion on the U.S. equity markets. In the context of an uncritical herd euphoria that characterizes the mainstream media, Fallstreet strives to provide investors with the information they need to make informed investment decisions. To that end, we provide a clearinghouse for bearish and value-oriented investment information, independent research, and an investment newsletter containing specific company selections.
© 2005-2022 http://www.MarketOracle.co.uk - The Market Oracle is a FREE Daily Financial Markets Analysis & Forecasting online publication.


