The True U.S. National Debt
Interest-Rates / US Debt Aug 25, 2010 - 03:26 AM GMTBy: James_Quinn

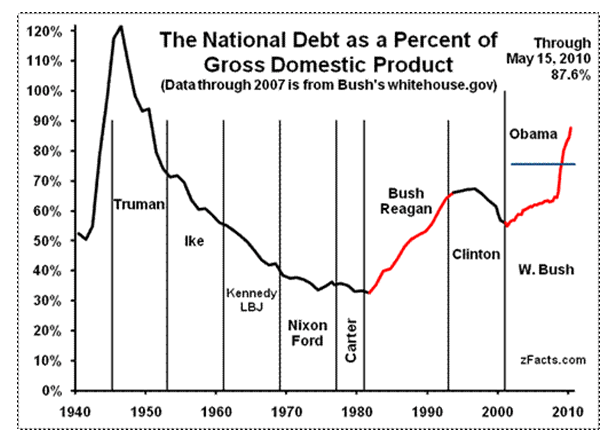
 When I read Paul Krugman and the other Keynesian boneheads saying that our debt is not a problem, they quote figures about our debt of $13.3 trillion versus our GDP of $14.6 trillion not being so bad. That is only 91% of GDP. They point to World War II when our national debt reached 120% of GDP. They say everything worked out after that.
Well lets analyze that comparison for just a second. In 1945, Europe, Russia and Asia lay in ruins. The devastation was epic. The United States stood alone as the only unscathed country in the world. America became the manufacturer to the world. We rebuilt Europe and Asia. Our GDP soared, as our National Debt declined from $269 billion in 1946 to $255 billion in 1951, remaining below $300 billion until 1963.
Today our reported National Debt is $13.362 TRILLION. This is the first big lie. There are two entities named Fannie Mae and Freddie Mac that happen to be 80% owned by the US government. Anyone who thinks these two companies can operate without the backing of the US Government is delusional. The US taxpayer is on the hook for these two disastrously run companies. Somehow, government accounting doesn’t require their debt to be considered the responsibility of the US taxpayer. This is a fraud, pure and simple. Their debt is our debt.
According to their latest 10Q filed in early August (links below), their debts are:
Fannie Mae $3.257 Trillion
Freddie Mac $2.345 Trillion
The true National Debt of the United States is $18.964 Trillion. Therefore, our debt as a percentage of GDP is really 130%. This is beyond the level reached during World War II. We are no longer the manufacturer to the world. We are the consumer to the world. The country adds $4 Billion per day to the National Debt. Our GDP is stagnating with future growth no better than 2% being realistic.
Kenneth Rogoff and Carmen Reinhart, after analyzing data over 200 years throughout the world, have concluded that once debt reaches 90% of GDP, a tipping point is reached. Crisis and collapse will ensue.
“After looking at data from 44 countries spanning 200 years, they’ve concluded that at ratios of debt to GDP up to 90%, there’s not much correlation between government debt and economic growth. Above 90%, however, median economic growth rates fall by one percentage point and average economic growth rates fall by about four percentage points. That makes the 90% level a kind of make-or-break point for countries that are hoping to grow their way out of debt. If the government debt load climbs above 90% of GDP, economic growth slows so much that growth is no longer a viable solution to reducing that debt. Above the 90% level, governments serious about reducing their debt load have to increasingly rely on “solutions” such as reducing wages and depreciating their currencies, which might over time increase global economic competitiveness enough to give a boost to national economic growth. In the short to medium term, however, these “solutions” inflict real pain on the citizens of the countries since they reduce standards of living.”
The U.S. is well beyond the tipping point. By the time Obama exits Washington DC in 2012, the ratio will be 140% of GDP. That is if the currency collapse doesn’t happen first.

Join me at www.TheBurningPlatform.com to discuss truth and the future of our country.
By James Quinn
James Quinn is a senior director of strategic planning for a major university. James has held financial positions with a retailer, homebuilder and university in his 22-year career. Those positions included treasurer, controller, and head of strategic planning. He is married with three boys and is writing these articles because he cares about their future. He earned a BS in accounting from Drexel University and an MBA from Villanova University. He is a certified public accountant and a certified cash manager.
These articles reflect the personal views of James Quinn. They do not necessarily represent the views of his employer, and are not sponsored or endorsed by his employer.
© 2010 Copyright James Quinn - All Rights Reserved
Disclaimer: The above is a matter of opinion provided for general information purposes only and is not intended as investment advice. Information and analysis above are derived from sources and utilising methods believed to be reliable, but we cannot accept responsibility for any losses you may incur as a result of this analysis. Individuals should consult with their personal financial advisors.
James Quinn Archive |
© 2005-2022 http://www.MarketOracle.co.uk - The Market Oracle is a FREE Daily Financial Markets Analysis & Forecasting online publication.


