Why following Stock Market Liquidity Inflows or Outflows are Very Important ...
Stock-Markets / US Stock Markets Sep 21, 2007 - 03:59 PM GMTBy: Marty_Chenard
 Liquidity levels and inflows are a critical element in the stock market, just as they are for Corporations and family finances.
Our Liquidity model is simple to understand. When in Expansion, the amount of liquidity flowing in is positive. When in Contraction, more liquidity is flowing out than in.
The importance of Liquidity: If your household excess income was $1,000 last month, then your liquidity flowing in would be positive. This would mean that you were able to pay all your bills and have an extra $1,000 to put into savings or new purchases. This is called Liquidity Expansion. You could then go out to dinner more, go to the movies, and buy your favorite things at the shopping Mall. Those businesses would also benefit with higher sales and profits.
On the other hand, if you had $1,000 more in bills than income, then your liquidity flowing in would be negative. This would mean that you went into debt by $1,000 and this would make you unable to make new purchases or save any money. This is called Liquidity Contraction. In this case, local businesses would suffer as you would stop going out to eat, and spend money only on necessities.
Similarly, the amount of Liquidity flowing into, or out of the stock market has the same affect. When Liquidity is in Expansion, more stocks are can and are being bought ... and when Liquidity moves to a very high level, the stock market has an impressive upside rally. When inflowing Liquidity is in Contraction, there is little money flowing into stocks, so the stock market pulls back or goes into correction.
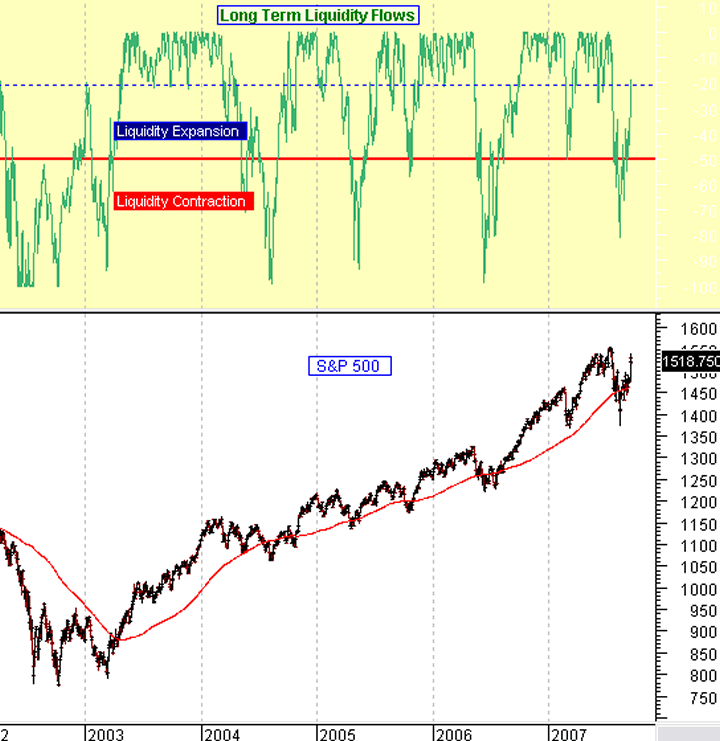
Below, is our Long Term Liquidity chart going back to 2002. Note how Liquidity was in Contraction in 2002 and how the stock market corrected. Without knowing this information, many investors tried to buy stocks cheap all the way down to the bottom. If they had know that Liquidity was not in Expansion, they would have waited until Liquidity was in Expansion ... or better yet, until Liquidity has at a high level.
Next note, the times that Liquidity was in high expansion, and how we had impressive rallies.
Liquidity inflow levels are an important gauge as to whether or not the stock market is in a corrective mode or a rally mode. (This chart can be found everyday on our paid subscriber sites.)

By Marty Chenard
http://www.stocktiming.com/
Please Note: We do not issue Buy or Sell timing recommendations on these Free daily update pages . I hope you understand, that in fairness, our Buy/Sell recommendations and advanced market Models are only available to our paid subscribers on a password required basis. Membership information
Marty Chenard is the Author and Teacher of two Seminar Courses on "Advanced Technical Analysis Investing", Mr. Chenard has been investing for over 30 years. In 2001 when the NASDAQ dropped 24.5%, his personal investment performance for the year was a gain of 57.428%. He is an Advanced Stock Market Technical Analyst that has developed his own proprietary analytical tools. As a result, he was out of the market two weeks before the 1987 Crash in the most recent Bear Market he faxed his Members in March 2000 telling them all to SELL. He is an advanced technical analyst and not an investment advisor, nor a securities broker.
Marty Chenard Archive |
© 2005-2022 http://www.MarketOracle.co.uk - The Market Oracle is a FREE Daily Financial Markets Analysis & Forecasting online publication.


