


Stock Market Analysis - Who really has control right now ... the Bulls or the Bears?
Stock-Markets / US Stock Markets Sep 15, 2007 - 12:57 PM GMTBy: Marty_Chenard
 There are different ways of measuring what is happening in the markets. Indexes measure the market, but some indexes are price weighted, some are market value-weighted or market share-weighted, and some are float weighted. It is sometimes why, a few stocks can have an over exaggerated impact on the movement of an index.
Index values don't answer a very important question, and that is, " What percentage of all the stocks are in an up-trend versus the percentage in a down-trend ?" (This is illustrated in today's chart below.)
It is an important question, because the answer tell's you who is in the majority ... the bulls or the bears.
So, who publishes this information on a daily basis? Fortunately, we publish it every day for our paid subscribers. It is not a simple task, because we have to run an analysis of the strength of every stock on every index, every night. We first run a program to count the number of stocks in an up trend, and then we re-run the program to count the number of stocks in a down trend.
We don't stop there ... we do two more runs. This time, we measure the number of "Very Strong" and "Very Weak" stocks. With that, we have a good view of what the bulls and bears are doing. With the four program computations, we can create bull/bear ratios for the Broad Market and the Leadership stocks in the market.
The answer relative to who is in control (bulls or bears) can then easily be determined by dividing the Strong and Weak numbers to produce a Ratio. If the number is positive, then there are more stocks trending up than down. If the number is negative, then there are more stocks trending down and the bears have the edge.
--------------------------------------------------------------------------------------------------------------------------
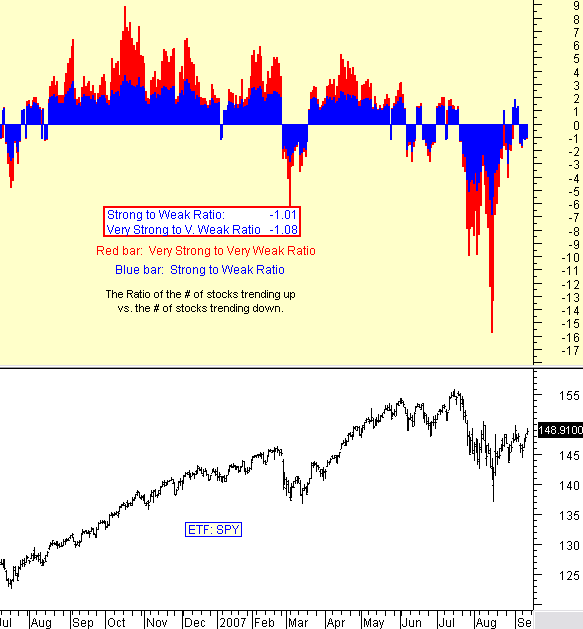
So, let's look at today's Ratio chart and analysis. There are two Ratios expressed in the top graph. The red bars show us the Ratio of Leadership stocks to the Down leaders. The blue bars show us the Ratio of the Up-Trending stocks versus the Down-Trending stocks in the Broad Market .
*** There are two things to note in this study. First, when the Ratios are in Positive Territory, the Bulls are in charge and the stock market rallies. When the Ratios are Negative, there are more Bears than Bulls.
Second, the relationship of the red Leadership Ratio to the blue Broad Market Ratio is important.
Why? Because Leadership stocks "lead or pull the market up or down". The higher the red Leadership bars are, the greater the positive pull is on the Broad Market. The opposite is also true.
You can can view the relationship of these Ratios to the SPY (ETF for the S&P 500) back to July 2006 on the chart below.
For the past week, both Ratios have remained negative ... and the Very Strong to Very Weak Ratio is "negatively greater" than the Broad Market (Strong to Weak) Ratio. Bottom line, stocks in a bear mode are more predominant than stocks in a bull mode. If Bernanke doesn't change this condition with a rate cut next week, then the Bulls will be in real trouble.
By Marty Chenard
http://www.stocktiming.com/
Please Note: We do not issue Buy or Sell timing recommendations on these Free daily update pages . I hope you understand, that in fairness, our Buy/Sell recommendations and advanced market Models are only available to our paid subscribers on a password required basis. Membership information
Marty Chenard is the Author and Teacher of two Seminar Courses on "Advanced Technical Analysis Investing", Mr. Chenard has been investing for over 30 years. In 2001 when the NASDAQ dropped 24.5%, his personal investment performance for the year was a gain of 57.428%. He is an Advanced Stock Market Technical Analyst that has developed his own proprietary analytical tools. As a result, he was out of the market two weeks before the 1987 Crash in the most recent Bear Market he faxed his Members in March 2000 telling them all to SELL. He is an advanced technical analyst and not an investment advisor, nor a securities broker.
Marty Chenard Archive |
© 2005-2022 http://www.MarketOracle.co.uk - The Market Oracle is a FREE Daily Financial Markets Analysis & Forecasting online publication.