UK ConLib Government to Use INFLATION Stealth Tax to Erode Value of Public Debt
News_Letter / UK Debt Jul 03, 2010 - 06:06 PM GMTBy: NewsLetter
 The Market Oracle Newsletter
June 29th, 2010 Issue #39 Vol. 4
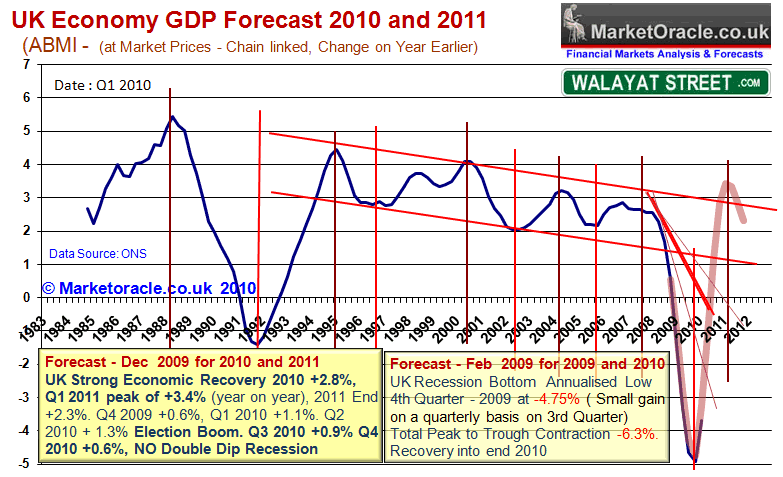
UK ConLib Government to Use INFLATION Stealth Tax to Erode Value of Public DebtInflation Mega-Trend Ebook Direct Download Link (PDF 3.2m/b) Dear Reader The Chancellor of the Exchequer, George Osborne hit the reset button on the UK economy by delivering the most radical budget of the past 30 years that has sought to cut an extra £40 billion from Britains annual budget deficit by 2014-15 which is on top of ALL of Labours March 2010 budget cuts and tax rises of £73 billion that the coalition left intact. The cuts totaling a withdrawal of £113 billion from the economy will be phased in by 2015-16 and by then total about 7.5% of GDP which is a huge amount that is deemed necessary to divert Britain from its current path towards bankruptcy that Labour had put it firmly upon as a consequence of running an annual budget deficit of 12% of GDP. Eventually an annual £113 billion (7.5% of GDP) being sucked out of the economy will undoubtedly have a significant impact on the economy thus resulting in lower economic growth than originally forecast in my UK Economic growth forecast of December 2009 (31 Dec 2009 - UK Economy GDP Growth Forecast 2010 and 2011, The Stealth Election Boom ) as illustrated by the below graph that will now require amending.
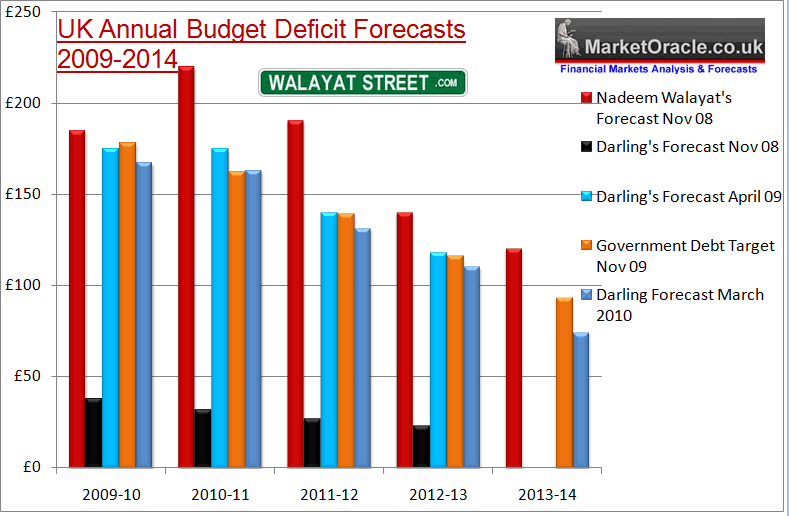
Double Dip Recession? The cost of the governments deficit reduction strategy is clearly that of lower economic growth, which the mainstream press has already concluded in large part signifies a double dip recession (a decline in GDP for 2 or more consecutive quarters) during 2010-2011 is increasingly becoming probable as illustrated by many highly read columnists / economists in the mainstream press : The Independant - 27th June 2010 - Osborne's first Budget? It's wrong, wrong, wrong! Joseph Stiglitz, the Nobel prizewinner who predicted the global crisis, delivers his verdict on the Chancellor's first Budget and tells Paul Vallely it will take the UK deeper into recession and hit millions – the poorest – badly Professor Joseph Stiglitz, who has been described as the biggest brain in economics, is distinctly unimpressed by George Osborne's strategy. This, he predicts, will make Britain's recovery from recession longer, slower and harder than it needs to be. The rise in VAT could even tip us into a double-dip recession. Daily Record - 28th June 2010 - BlanchFlower Warns of Double Dip Recession or Worse David Blanchflower, a former member of the Bank of England's monetary policy committee, said Osborne had failed to heed warnings, from US president Barack Obama and others, that withdrawing fiscal stimulus too soon could endanger recovery. Blanchflower, who was seen as a left-wing influence on the Bank's committee, said: "I am now convinced that as a result of this reckless Budget the UK will suffer a double-dip recession or worse." Guardian - 22nd June 2010 - Budget 2010: Fears tough budget could plunge UK back into recession There were warnings tonight that the toughest budget in decades could plunge Britain back into recession, leaving the private sector unable to create the jobs needed to make up for public sector cuts. Whilst double dip recession talk rages in the press, however the advantage the UK has over many European countries is in its ability to devalue the exchange rate to boost growth and by keeping interest rates at near zero regardless of the fact that the inflation rate has been above the banks upper limit of 3% now for 6 months. This coupled with the nuclear option of printing money which the Bank of England will likely deploy again ensures that the actual risk of a double dip recession materialising is far less probable than the headlines imply. Dealing with Labours Debt and Deficit Legacy My existing long standing annual budget deficit projections as illustrated by the below graph dating back to November 2008 (Bankrupt Britain Trending Towards Hyper-Inflation?) now need to be scrapped to take into account of the new government having hit the reset button and set its own targets for annual budget deficits and total accumulated debt which have now been accompanied with actual detailed budgetary measures such as the VAT hike to 20%, and social benefits bill cut of £12.5 billion that form a mostly credible programme for deficit reduction, something that the last Labour government NEVER produced during the whole of the preceding 2 years. Labours Last Budget (March 2010) Deficit Reduction Targets
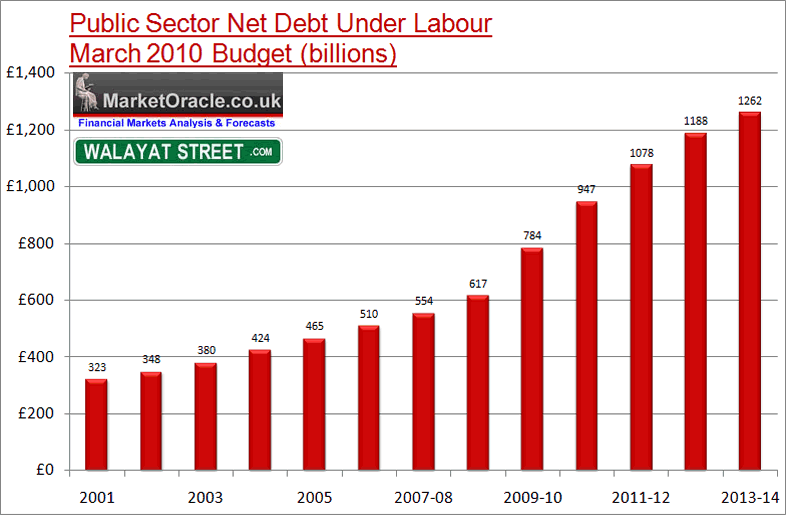
Labours plan was never credible because according to Labours own forecasts an additional £478 billion would have been borrowed over the next 4 years that would have been ADDED to the total accumulated debt at the end of 2009-10 of £784 billion, therefore according to the Labour government total public sector net UK debt by the end of 2013-14 would have increased from 60% of GDP to 80% of GDP (after allowing for economic growth of 1.5% to 2%) i.e. total debt would have increased to around £1.26 trillion even IF Labour had been able to stick to its targets as illustrated by the below graph
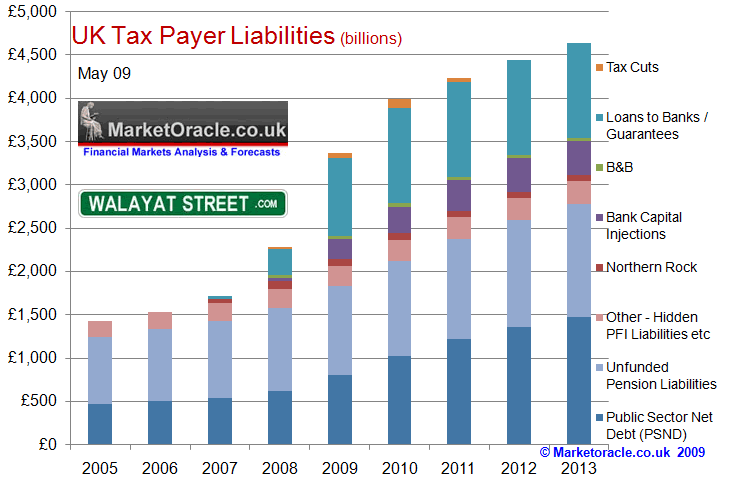
Actual Labour government debt would have been at least £100 billion higher than Labours March 2010 forecast, as my earlier graph illustrates that Labour has consistently failed to meet its budget targets therefore actual total public sector net debt by 2013-14 would have been £1.4+ trillion or about 88% of GDP. However on top of public debt, total liabilities continue to target approx £4.5 trillion by 2013-14, (as illustrated by the below graph which was last updated in May 2009), this is despite George Osbourne's emergency deficit cutting budget as a consequence of the latest projections for public sector pensions and european debt default risks, given another financial crisis total liabilities could yet look set to be even higher. All of this is a sitting time bomb that will explode in the government bond markets which will send interest rates sharply higher as illustrated in the Inflation Mega-trend Ebook. The trigger for which could be a string of chain reaction European sovereign debt defaults, regardless of the new governments own programme for deficit reduction which still does nothing to actually halt accumulation of new debt.
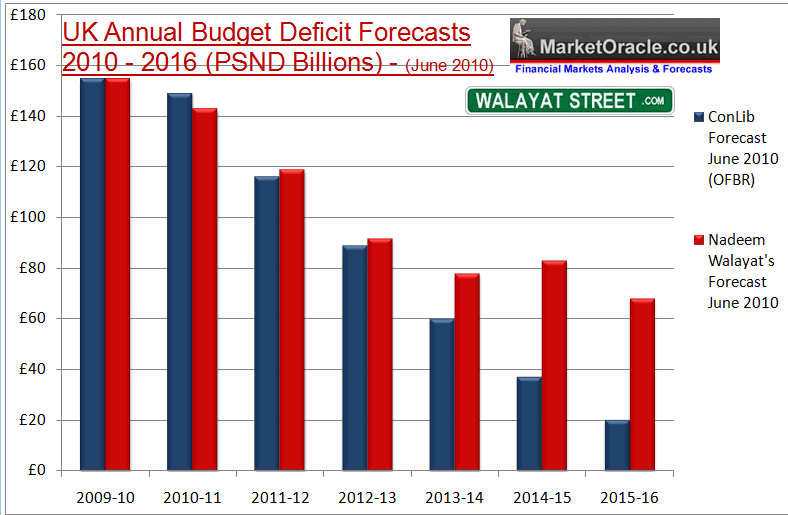
Con-Lib Coalition Government Budget Deficit Reduction Strategy The ConLib government has announced that they will reduce the annual budget of £156 billion to £20 billion by 2015-16. My own interpretation is that higher unemployment as a consequence of between 500,000 and 700,000 public sector job losses to be announced in September 2010 will mean significantly lower economic growth during the next 4 years than that which the government is presently forecasting which means that the deficit will likely be significantly higher later in the cycle i.e. as the job losses take place, with UK unemployment possibly rising towards 3 million. The ConLib governments annual budget deficit forecasts as a consequence of phasing in of spending cuts and tax rises are:
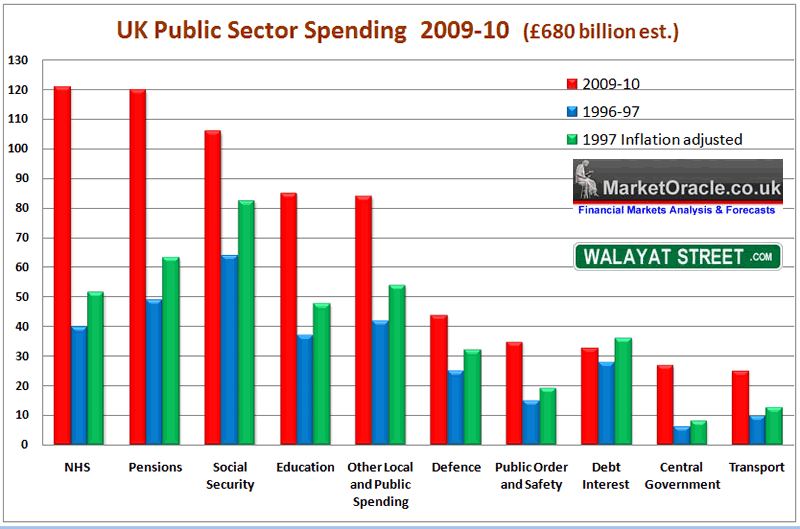
Key Problems with deficit reduction targets 1. Unemployment - Higher benefit payments as a consequence of higher unemployment as between 500,000 and 750,000 public sector workers lose their jobs over the next 4 years, the problem here is the culture and ethos of public sector workers means that most are unemployable in the far more flexible private sector unless they change their mindset. This suggests a cut in the benefits budget of £11 billion is going to be very hard to achieve, and more probably only to the tune of £7 billion per year by 2014-15. 2. Economic growth - will be significantly lower than even the revised forecasts that average 2.5% per year over the next 5 years, even a 0.5% reduction in annual growth will result in reduced government revenues of £3 billion per year against expectations for an average increase of of £15 billion per year. 3. Public Sector 25% Spending Cuts - The Government intends to target 25% of spending cuts across non ring fenced spending departments to culminate in an annual spending cut of £21 billion on top of Labours planned cuts of £20 billion. However the problem here is that spending cuts of 25% are just not possible in my opinion, especially as 1/3rd of the governments annual budget has been ring fenced for growth (NHS and Pensions) as the below graph illustrates -
Therefore 10% to 15% is achievable but 25% ? This means that there exists an approx £15 billion annual hole in the governments plans or about £60 billion over the 4 years from 1st April 2011, which means higher borrowing and deficits than forecast, and also means that further tax rises and spending cuts are likely in future budgets which therefore implies approx. £30 billion of extra deficit. 4. Election Boom 2014-15 - During an election year the government will not seek to cut the deficit as the government forecasts but rather expand the deficit by at least £5 billion in an attempt to create an election boom. Therefore the deficit will spike higher during the election year. Therefore it is difficult to see how the government will be able to achieve its stated budget reduction target of getting the annual deficit down to just £20 billion by 2015-16. Whilst the government is expected to trend close to target for the next 3 years, however thereafter the governments (OFBR) and my deficit forecasts diverge as the coalition governments primary focus will be towards getting re-elected in May 2015. In all likelihood this means that total debt will be over £100 billion higher than that which the government is forecasting as illustrated by the annual budget deficits forecast graph below-
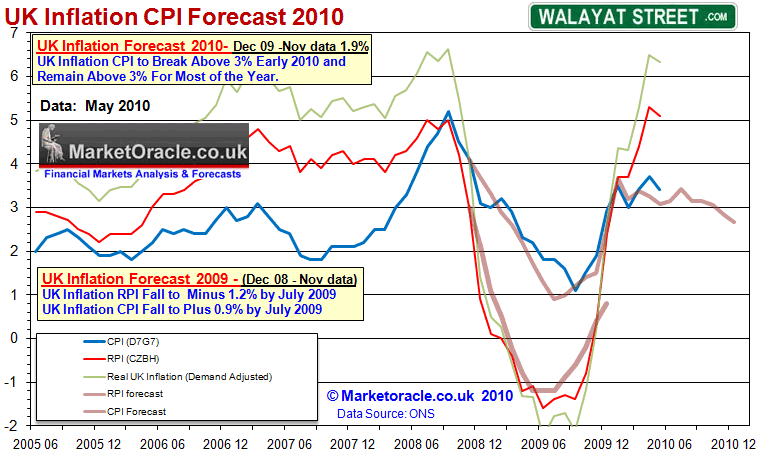
Whilst the ConLib's deficit reduction targets represent an improvement under the Labour governments target that would have resulted in extra borrowing of £478 billion over the next 4 years if the Labour government managed to stick to its targets. However the ConLib government will still expand total debt by £414 billion over the next 4 years, and £471 billion over the next 6 years to reach £1,242 billion, so hardly an eye shattering improvement. So if the total public sector net debt is going to increase by £471 billion, how can the ConLib government prevent Britain from going bankrupt ? The answer in one word is - INFLATION. Inflation continues to run well beyond the Bank of England's 2% target at currently 3.4% CPI, and 5.1% RPI, inline with the UK inflation forecast for 2010 ( 27th December 2009 (UK CPI Inflation Forecast 2010, Imminent and Sustained Spike Above 3%). The ConLib governments and bank of England's objective remains to continue with the mantra of temporary inflation whilst all the time using inflation as one of its primary tools to stealthily erode the value of the annual deficit and total accumulated debt by stealthily taxing earnings and savings to ensure annual interest payments that are set to grow to £70 billion remain manageable in real terms.
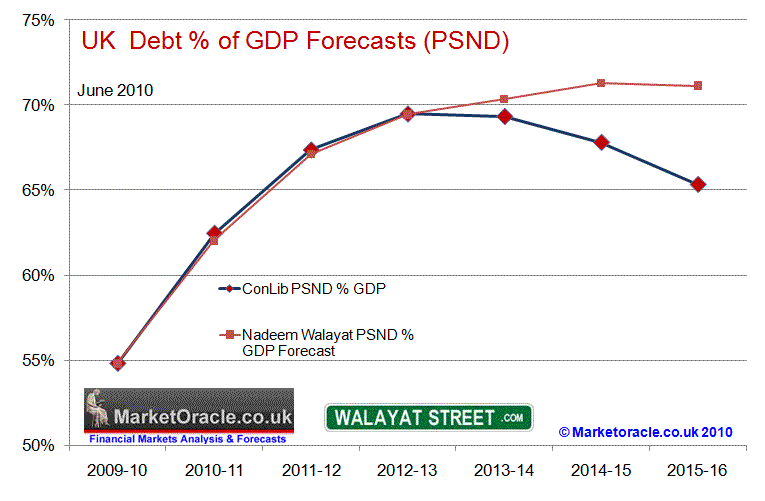
Inflation as illustrated at length in the INFLATION MEGA-TREND EBOOK (Free Download), is a powerful stealth tax that the new government will use to first stabilise and then reduce the debt in terms of percentage of GDP as the below graph illustrates that despite total debt increasing by 50% to £1.24trillion, the ConLib government aims to stabilise the debt at about 70% of GDP and then target a trend lower to about 65% of GDP by 2016. However my higher deficit projections imply that actual Debt % will start to deviate from the ConLib expectations during 2014.
Again, inflation is the primary mechanism that will be used to erode the value of UK debt in real terms over the next 5 years by 15-20%. Therefore it is an imperative that savers and investors protect their wealth from the governments stealth tax as illustrated at length in the Inflation Mega-Trend Ebook. This deficit and debt projection analysis will feed into my next in depth analysis that will seek to update the UK GDP growth forecast for at least the next 2-3 years (ensure you are subscribed to my always free newsletter to get this in your email in box). Comments and Source : http://www.marketoracle.co.uk/Article20682.html By Nadeem Walayat Copyright © 2005-10 Marketoracle.co.uk (Market Oracle Ltd). All rights reserved.
Disclaimer: The above is a matter of opinion provided for general information purposes only and is not intended as investment advice. Information and analysis above are derived from sources and utilising methods believed to be reliable, but we cannot accept responsibility for any trading losses you may incur as a result of this analysis. Individuals should consult with their personal financial advisors before engaging in any trading activities.
You're receiving this Email because you've registered with our website. How to Subscribe Click here to register and get our FREE Newsletter To access the Newsletter archive this link Forward a Message to Someone [FORWARD] To update your preferences [PREFERENCES] How to Unsubscribe - [UNSUBSCRIBE]
The Market Oracle is a FREE Financial Markets Forecasting & Analysis Newsletter and online publication. |
||||||||||||||
© 2005-2022 http://www.MarketOracle.co.uk - The Market Oracle is a FREE Daily Financial Markets Analysis & Forecasting online publication.


