Crude Oil tumbles through support levels, is the bull market over ?
Commodities / Forecasts & Technical Analysis Jan 04, 2007 - 11:05 PM GMTBy: Nadeem_Walayat
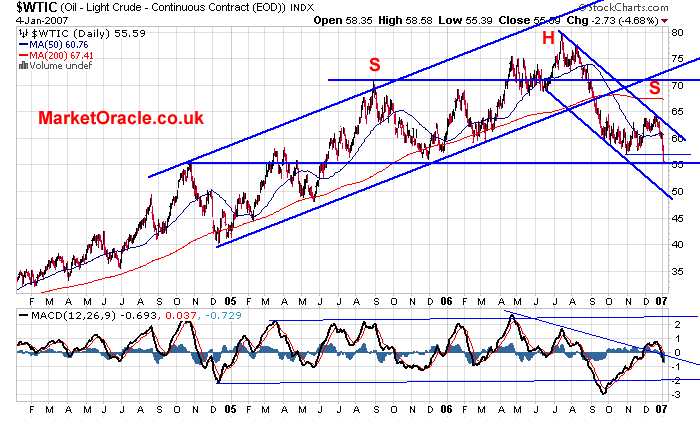
Crude oil plunges through key support levels built during the recent consolidation area of 56 to 63.
Crude Oil had been in an up trend since start of 2002, which had taken the price from just over $15 to just shy of $80 going into July 2006. Now following a failed attempt to resume the up trend, crude is threatening to end the bull market by yesterdays price action in the face of a much milder than expected US winter.
Our last article on crude oil warned of a probable sharp drop in crude oil during 2007 ( 3rd Dec 06 - Crude Oil rallies, but a widening Contango could lead to a collapse in oil prices during 2007 ) "It means that the continuing build up in inventories of crude oil for future delivery, rather than being rolled over, will at some point be delivered, and as and when that happens (probably sooner rather than later), it will lead to a sharp sell off in crude oil prices !"
Technical Analysis
- Price Patterns - The danger lights are flashing RED for crude oil. As the pattern developing given the recent sell off resembles the classic Head and Shoulders pattern. Such a pattern would call for a move equal to the height of the head from the neck line.or approx $23 lower to $ 33 ! So its implications are huge. Already we had considered a move to $40 during 2007 as likely. This pattern is confirming a move of such magnitude.
- Trend Lines - The support trendline from Dec 05 was breached in September, however on a longer-term chart from 2002, Crude Oil had held support, Which gave the market support at $56 after which the rally occurred to $64. Since that rally petered out Crude Oil is now clearly in a sharp downtrend channel which targets much lower oil prices, infact the trendline's do project to below $40 by mid year..
- Support - Major support lies at current levels i.e. between the zone $50 to $55. Given the sharp sell off, it is likely that this support will initially at least halt the decline.
- MACD - The MACD is clearly bearish, where the up move in price during November and December 2006, was purely to unwind an oversold state. The MACD suggests another leg lower of similar magnitude to the July to October decline.
- Time - The timing for the decline is four months, which given the recent sell off suggests some consolidation rather continuing the move lower in the immediate future.
Conclusion - The anticipated sell off in crude occurred sooner than expected as the corrective rally FAILED to make any significant movement towards $70. This is very bearish for crude oil. And implies that crude oil is on target to achieve $40 or lower during 2007. The weakened trend suggests it will achieve this target during the first half of 2007. The reasons why are numerous, as the reasons why crude oil should go higher are also numerous, so I will only mention one fundemental reason which was stated in my article of 3rd December, namely the build up on inventories in anticipation of forward selling by producers which was expected to hit the market hard during 2007 and drive prices sharply lower.
The crude market had been waiting for a trigger for this sell off to occur, and it appears that trigger was news of mild US winter, though any triggering news item would have lead to the same conclusion.
by Nadeem Walayat
Disclaimer - This Analysis / Forecast is provided for general information purposes only and not a solicitation or recommendation to enter into any market position, and you are reminded to seek independent professional advice before entering into any investments or trading positions.
Attention editors and publishers ! This article can be republished. Republished articles MUST include attribution to the author and the following short paragraph:
The Market Oracle is a FREE Financial Markets Forecasting & Analysis online publication. We aim to cut through the noise cluttering traditional sources of market analysis and get to the key points of where the markets are at and where they are expected to move to next ! To view articles, visit http://www.marketoracle.co.uk
© 2005-2022 http://www.MarketOracle.co.uk - The Market Oracle is a FREE Daily Financial Markets Analysis & Forecasting online publication.


