Further Stock Market Weakness Expected - Leading Market Indicators: Part 1
Stock-Markets / US Stock Markets Aug 21, 2007 - 02:00 AM GMTBy: Donald_W_Dony
This report is the first of a two-part series reviewing several key leading indicators on the equity markets. With recent volatility due to the subprime mortgage exposure and drops of 10% or more to major indexes, the timing and direction of the markets is vital now for many investors.
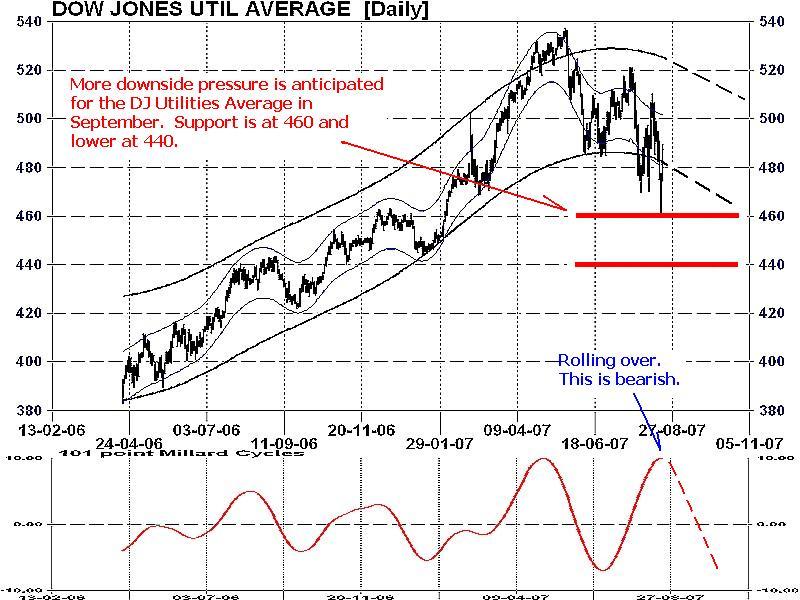
The Dow Jones Utilities Average has a 40 year history of leading the Dow Jones Industrial Average. Utilities as a sector, are the most sensitive to interest rate movements and are normally the first group of stocks to reverse their trend ahead of the DJIA.

The Dow Jones Utilities Average (Chart 1) peaked in early May, two months before the DJIA. Downward pressure is still building and expected to continue as the Utilities Average rolls over with a low anticipated in the second half of September. The target is the first price support at 460.

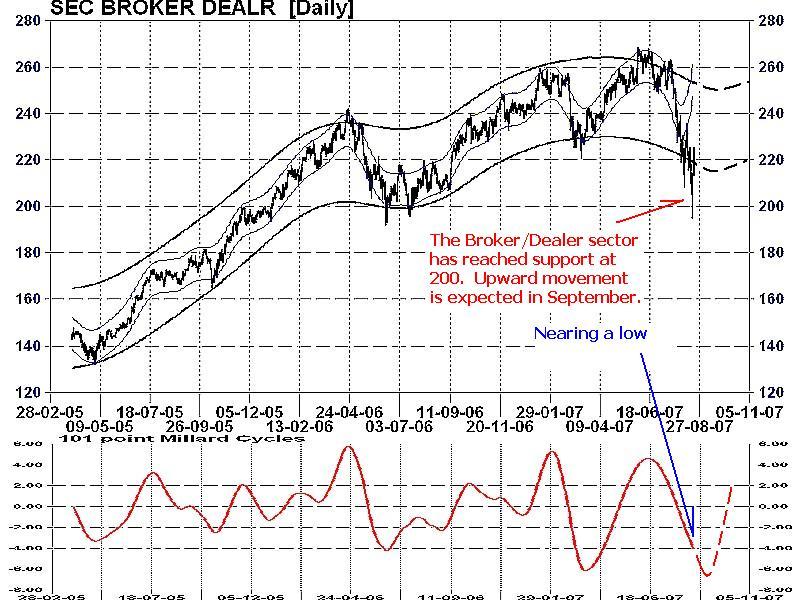
The Broker/Dealer sector (Chart 2) is a reflection of corporate attitude toward the economy. As the main income for this group is through underwriting new business financing, strength or weakness here indicates how bullish or bearish corporations are about new IPOs. This sector currently is consolidating and nearing the end of its short decline. The final low is anticipated in early September at the 200 level.

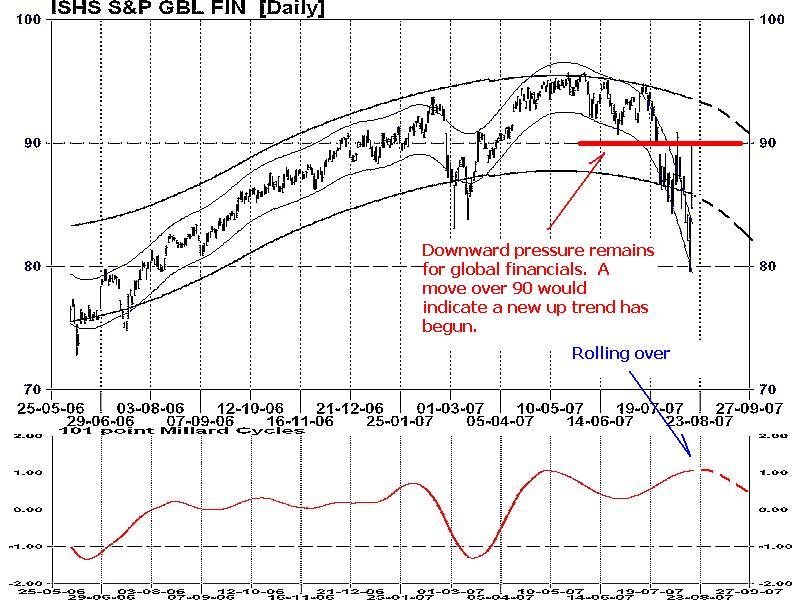
The last leading indicator is the iShares S&P Global Finance. This key ETF (Chart 3) is a subset of the Standard & Poors Global 1200 Index, and measures the performance of companies that S&P deems to be part of the financial sector. Component companies include banks, diversified financial companies, insurance companies, real estate companies, savings and loan associations. As financial organizations were the main targets of this recent world market correction, early signs of a recovery is important. Technical evidence points to a short-term bounce this week followed by additional weakness. A low is projected for late September or early October with 80 as the final target.
My Conclusion: Though the Broker/Dealer sector suggests stability is near, the Dow Jones Utilities Average and global financials point to additional downward pressure over the next four weeks. This action signals the high probability of lower numbers from most major stock indexes in September.
Next week, three more key leading market indicators will be reviewed.
More complete information will be available in the up-coming September newsletter. Go to www.technicalspeculator.com and click on member login.
Your comments are always welcomed.
By Donald W. Dony, FCSI, MFTA
www.technicalspeculator.com
COPYRIGHT © 2007 Donald W. Dony
Donald W. Dony, FCSI, MFTA has been in the investment profession for over 20 years, first as a stock broker in the mid 1980's and then as the principal of D. W. Dony and Associates Inc., a financial consulting firm to present. He is the editor and publisher of the Technical Speculator, a monthly international investment newsletter, which specializes in major world equity markets, currencies, bonds and interest rates as well as the precious metals markets.
Donald is also an instructor for the Canadian Securities Institute (CSI). He is often called upon to design technical analysis training programs and to provide teaching to industry professionals on technical analysis at many of Canada's leading brokerage firms. He is a respected specialist in the area of intermarket and cycle analysis and a frequent speaker at investment conferences.
Mr. Dony is a member of the Canadian Society of Technical Analysts (CSTA) and the International Federation of Technical Analysts (IFTA).
Donald W. Dony Archive |
© 2005-2022 http://www.MarketOracle.co.uk - The Market Oracle is a FREE Daily Financial Markets Analysis & Forecasting online publication.


