FTSE 100 Index stock market forecast for 2007
Stock-Markets / Forecasts & Technical Analysis Dec 29, 2006 - 11:11 PM GMTBy: Nadeem_Walayat
The FTSE ended 2006 at 6220.80, up about 11% for the year and up 90% from the 2003 low.
A recap of the FTSE trend during 2006 before the forecast for 2007 - The FTSE started 2006 at 5,618, after having already built on 2 good years so expectations were starting to slacken with many commentators suggesting that the FTSE could decline during 2006. Our forecast at the start of the year was for the FTSE 100 index to rise to 6000 by the end of 2006, so a 3% deviation from the actual year end close.
The FTSE initially rallied much more strongly than expected during Jan to April 06, due to a fall in money market interest rates, which took the FTSE Into overbought territory. This was highlighted in the forecast of 30th April 06, which suggested that the FTSE was headed from 6133 to 5600 over the next 5-6 months. The FTSE decline did occur to below 5500, when the pattern observed during late June 06 was that the FTSE was attempting to make an ABC bottom, as the FTSE had fulfilled its downside target in price terms. Given the sharp decline the trend to October was no longer clear-cut at that point (FTSE 5684).
On 12th Sept 06, at FTSE 5850, I forecast that the FTSE is likely to continue trending higher and to break the prev high of 6135 by end December 2006. The forecast of 17th October 2006, with FTSE at a 5 year high of 6172, called for the FTSE to continue to rise to a target peak of 6280, the actual high made for the FTSE for 2006 was 6272. The forecast of 11th Nov 06, (FTSE 6232) called for the FTSE to have a significant correction with a target of 5850. The FTSE fell from 6232 to 5985 over the next 3 weeks. And the final general stock market forecast of 17th December 2006, (FTSE 6220) was for a sharp drop starting January 2007, with prices expected to be supported into the year end.
In the final analysis, 2006 proved to be a relatively good year in forecasting terms, the market basically did what was expected of it, without any real surprises.
FTSE 100 Index Forecast for 2007

Technical Analysis
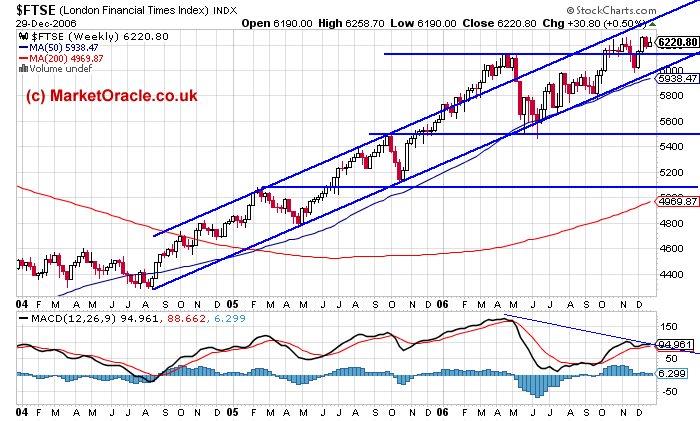
- Trend Lines - The FTSE 100 is clearly in an up trend channel with current resistance at 6500 and support at 6000. This projects to year end levels of between 7000 and 6500. There is no technical sign to the end of the bull market going into 2007.
- Support - The FTSE has built heavy support at 6000, both in the lead up to the recent highs and confirmed during the correction that bottomed in December 2006, thus any decline is likely to be supported at 6000 area.
- MACD - The MACD has weakened compared to the earlier trend during 2006 leading into May 06, this suggests the trend during 2007 will be more laboured, difficult, volatile, so likely to spend more time hugging the up trendline rather than the up channel line.
- 50 Week Moving average - Has proved very reliable in acting as support, presently at 5938, this also confirms the up trend channel line.
- Price Patterns - The FTSE appears to be in the early stages of making a double top pattern, with the neckline at 6000, this would suggest a target decline to 5800.
- Time - The FTSE is generally strong during the period Jan to March - Which is as much of the media is reporting as expected price action. Which means adopting a contrarian viewpoint on this piece of the puzzle at least.
Putting it all together - I expect the FTSE to start a correction in January that will take the FTSE down to 6000. If 6000 fails to hold, despite the solid support in the area, then the FTSE targets a move to 5800. The time frame for such a move is by March 2007. From there, the FTSE should find support, and make a base during the next 2 months, before trending higher again to New Highs ! How high could the FTSE go by year end. Well the high for the year could even breach 7000 !. And the year end price may be around 100 points lower so around 6900. This represents an advance of about 9.5% for the year.
The risks to the forecast are if the UK economy slumps during 2007, of which at this point in time there are NO signs. Or interest rates surge beyond 5.5% to control inflation, again there is little sign of this either.As with the forecast for 2006, repeatedly check by for the most recent forecasts which refine the expected trend in response to the ever changing technical picture.
by Nadeem Walayat
(c) Marketoracle.co.uk 2006. All rights reserved.
Disclaimer - This Analysis / Forecast is provided for general information purposes only and not a solicitation or recommendation to enter into any market position, and you are reminded to seek independent professional advice before entering into any investments or trading positions.
© 2005-2022 http://www.MarketOracle.co.uk - The Market Oracle is a FREE Daily Financial Markets Analysis & Forecasting online publication.


