


U.S. Debt Crisis, Battle for the Budget
Economics / US Debt Mar 23, 2010 - 03:56 PM GMTBy: Casey_Research

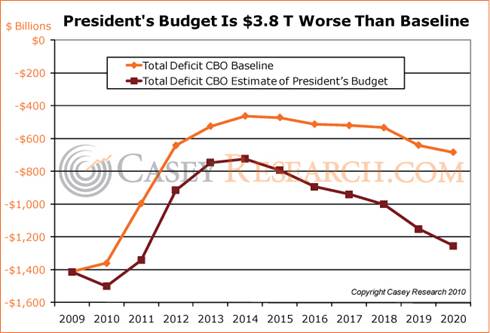
 Bud Conrad, Editor, The Casey Report writes: Recently the Congressional Budget Office (CBO) published its scoring of President Obama's budget for the next 10 years. It shows a budget deficit of $9.8 trillion. That is just shy of $4 trillion worse than the CBO’s baseline budget, a budget that includes only the laws as currently enacted, with no estimates of any new programs lawmakers may add that worsen future projections.
That our budget is out of control is no surprise, but the charts I present here should provide some perspective of just how dangerous this set of budget estimates could turn out to be. The first chart below shows the amount of red ink in each year for the two CBO estimates.
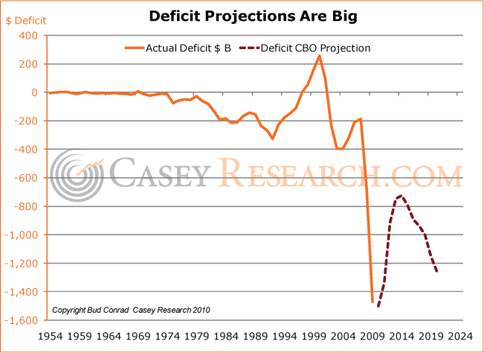
To get a visual interpretation of just how big these budget deficits have become, I plotted the long-term history, then tacked on the CBO evaluation of the president's proposal. Knowing the propensity of governments to spend more than they promise makes one question if the large improvement shown in the dotted line will actually occur. Even if nothing changes, however, the results look like they could be very damaging for other aspects of our economy.
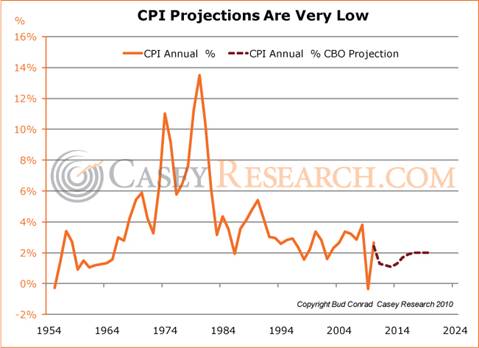
One aspect of the CBO projections that is difficult to defend is the expectation that inflation will stay incredibly low. In the next chart, I present the same sort of long-term history, coupled with the projection, for the Consumer Price Index (CPI).
In the next chart, I put together two of the most important measures: the three-month T-bill interest rate and the deficit expressed as a percentage of the gross domestic product (GDP). Both history and projection are shown.
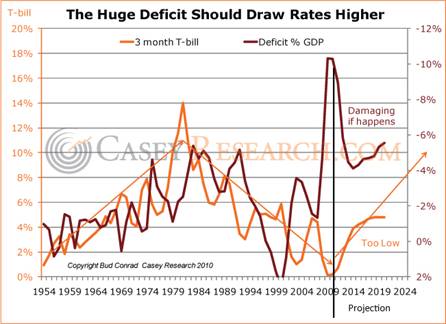
The most important observation is just how disastrous the current deficit is in the historical context, even after rationalizing it by dividing it by the GDP. I overlaid the two series to show that higher deficits in the past tended to occur along with higher interest rates.
As you can see, we now have a significant anomaly, with the budget deficit at its worst in half a century, while interest rates remain near their lows for the period. A closer look at history shows many divergences, to the point that in the short term these two series tend to bounce in opposite directions. That is probably because when the economy shows weakness, the government expands its spending and collects lower taxes, so the deficit becomes worse. Thus, in the short-term cycle of a few years, these two measures often move in opposite directions.
But the situation we face now is much bigger than anything we've seen since the 1950s. The government bailouts and stimulus are at record levels, and the special actions of the Federal Reserve have driven interest rates close to 0%. It is my expectation that both inflation and interest rates will rise dramatically because of these large deficits.
I also think the projected interest rates are much lower than what I expect the deficit would require. As foreigners and others recognize how seriously indebted the U.S. government is becoming, they will expect higher interest rates to compensate for the debasement of the currency.
The budget analysis goes further in calculating the expected growth of the economy, which ranges from 2 to 4% over the years. Those are not large numbers for real GDP, but there is no expectation of another recession during the decade. If the economy didn't grow, tax revenue would be less, and the budget deficit would be worse.
While interest rates are expected to rise as shown in the chart above, the projections expect that they roll over and stop rising at around 5%. That is contrary to my expectations that they will be much higher, and even perhaps closer to 10%, by the end of the decade. If they are, the cost of funding the outstanding government borrowing escalates rapidly because the increased interest has to be added to the debt so that the debt grows even more.
The problem from the onset of this crisis has been the debt, and that continues to be the case.
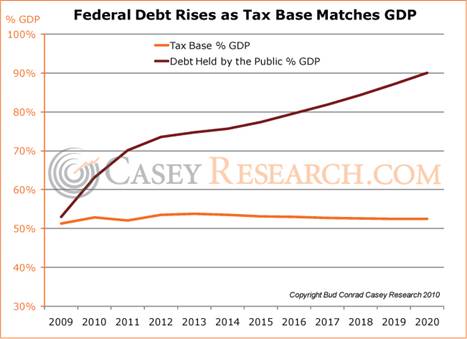
Leaving aside the above two adjustments that could make the budget deficit worse, it’s helpful to look at the outcome with the given assumptions and see where it leads. Perhaps the most problematic result is that the debt of the federal government held by the public grows from $7.5 trillion in 2009 to $20 trillion by 2020. Such big numbers are hard to understand, though you can get some sense of things by considering that the government is intending on almost tripling the debt in just 11 years. The ratio of this outstanding debt to the GDP gives a flavor of how dangerous the situation has become. As Ken Rogoff and Carmen Reinhart have indicated in their new book, when we approach 90% government debt of GDP, we have serious potential for a currency crisis. As you can see, we are well on our way to those levels, even without assuming the two adjustments above.
How will the deficit be funded?
The question arises who will service the rising levels of debt. Clearly the taxpayers are on the hook for all these projections, with more to come. So the question becomes whether the tax base can grow fast enough to provide support for servicing the debt. The CBO gave us two series for the tax base. One is Domestic Economic Profits, and the other is Wages and Salaries. The basic assumption is that these are the main revenue streams that can be taxed by the government to fund its expenses. I added these two series together and divided by the GDP to determine if the tax base is growing more rapidly than the economy. Unfortunately, but as expected, the orange line in the above graph shows that the tax base only grows about as fast as the economy itself. That's not surprising, but the contrast to the rapid growth in debt will be a serious source of problems, as the only way the debt can be sustained will be through increasing the tax rates, and probably quite dramatically.
The latest set of budget predictions will probably be wrong, and not just because the assumptions are too optimistic, but because there is a relatively high probability that something will go off track to cause a major shift before the 10 years are completed. Unfortunately we are not preparing ourselves for such problems, and so I would interpret the CBO projections as being far too rosy.
Bud Conrad is the chief economist at Casey Research, and crunching numbers like these is his daily bread. It also enables him, together with the rest of the Casey Report team, to accurately forecast what’s in store for the U.S. economy… a skill that subscribers to The Casey Report have come to highly appreciate. Learn more about what the future holds and how to profit by clicking here.
© 2010 Copyright Casey Research - All Rights Reserved
Disclaimer: The above is a matter of opinion provided for general information purposes only and is not intended as investment advice. Information and analysis above are derived from sources and utilising methods believed to be reliable, but we cannot accept responsibility for any losses you may incur as a result of this analysis. Individuals should consult with their personal financial advisors.
© 2005-2022 http://www.MarketOracle.co.uk - The Market Oracle is a FREE Daily Financial Markets Analysis & Forecasting online publication.