


U.S. Jobs Contract by 36,000; Unemployment Rate Steady at 9.7%
Economics / Employment Mar 05, 2010 - 12:02 PM GMTBy: Mike_Shedlock

 Today the BLS reported 36,000 job losses with the unemployment rate holding at 9.7%. Before diving into the numbers let's analyze the snow job ahead of the report.
Speaking before Congress, Fed Chairman Ben Bernanke harped about snow, warning policymakers will "to be careful about not overinterpreting" the upcoming data." In the wake of that warning, economists busily upped their projections for job losses in February, some by as much as 220,000 jobs.
I talked about that yesterday in Range of Snow Impact on Jobs: Negligible to 220,000; Have Your Snow Job Decoder Ring Handy?
Snow Job Decoding
Did 220,000 people not receive any pay for the period in question?
Color me skeptical.
In terms of the unemployment rate, the blizzards will not have an effect. In terms of the reported jobs number there will be an impact but the most likely impact is in the number of hours worked.
Regardless, expectations as to the importance of the blizzard range from negligible all the way to 220,000. Whatever the affect was, it will be over by next month although I have seen analysis that says the effects will last until May.
In today's job report, the BLS chimed in about snow, confirming the above.
BLS Confirms Bernanke's Snow Job
Effect of Severe Winter Storms on Employment Estimates
Major winter storms affected parts of the country during the February reference periods for the establishment and household surveys.
In the establishment survey, the reference period was the pay period including February 12th. In order for severe weather conditions to reduce the estimate of payroll employment, employees have to be off work for an entire pay period and not be paid for the time missed. About half of all workers in the payroll survey have a 2-week, semimonthly, or monthly pay period. Workers who received pay for any part of the reference pay period, even one hour, are counted in the February payroll employment figures.
While some persons may have been off payrolls during the survey reference period, some industries, such as those dealing with cleanup and repair activities, may have added workers.
In the household survey, the reference period was the calendar week of February 7-13. People who miss work for weather-related events are counted as employed whether or not they are paid for the time off.Should Bernanke Have Known That?
Yes. Did he know that and make misleading statements hoping to get economists to up their estimates of job losses hoping to beat the number? Probably not, but who knows? The most likely explanation is that Bernanke is once again clueless about the real economy and in this case reporting procedures as well, just as he has been for his entire career.
As for those projecting losses of 200,000 and 220,000 on account of snow, you be the judge. Meanwhile, on to the jobs report.
Jobs Contract By 36,000
This morning, the Bureau of Labor Statistics (BLS) released the February 2010 Employment Report.
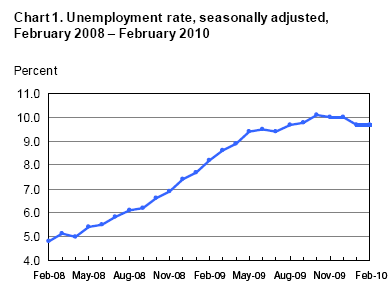
Nonfarm payroll employment was little changed (-36,000) in February, and the unemployment rate held at 9.7 percent, the U.S. Bureau of Labor Statistics reported today. Employment fell in construction and information, while temporary help services added jobs..
Unemployment Rate - Seasonally Adjusted
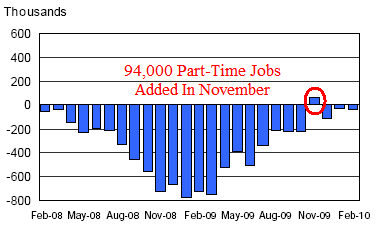
Nonfarm Payroll Employment - Seasonally Adjusted
Ignoring that outlier circled above, jobs have contracted 26 consecutive months.
Establishment Data
Highlights
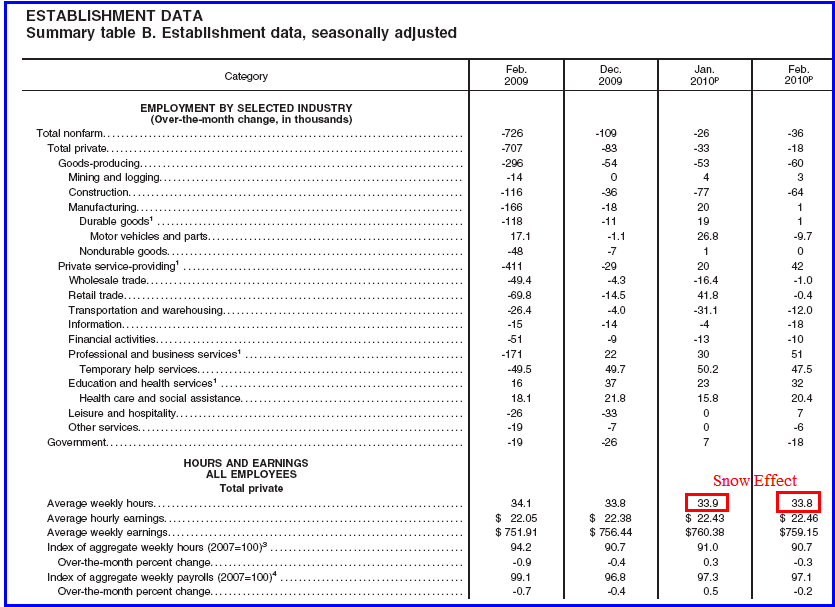
- 36,000 jobs were lost in total vs. 26,000 jobs lost last month.
- 64,000 construction jobs were lost vs. 77,000 lost last month.
- 00,001 manufacturing jobs were added vs. 20,000 added last month.
- 42,000 service providing jobs were addedvs. 20,000 added last month.
- 00,000 retail trade jobs were added vs. 42,000 added last month.
- 51,000 professional and business services jobs were added vs. 30,000 added last month.
- 32,000 education and health services jobs were added vs. 23,000 added last month.
- 07,000 leisure and hospitality jobs were added vs. 00,000 added last month.
- 18,000 government jobs were lost vs. 7,000 added last month.
- 48,000 temporary help jobs were added vs. 50,000 added last month
Professional services contributed 51,00 jobs to the plus side, but 50,000 of them were part-time jobs!
Note: some of the above categories overlap as shown in the preceding chart, so do not attempt to total them up.
Index of Aggregate Weekly Hours
Work hours were down one tick to 33.8 but this could be a snow effect. Short work weeks contribute to household problems. Moreover, before hiring begins at many places, work weeks will increase.
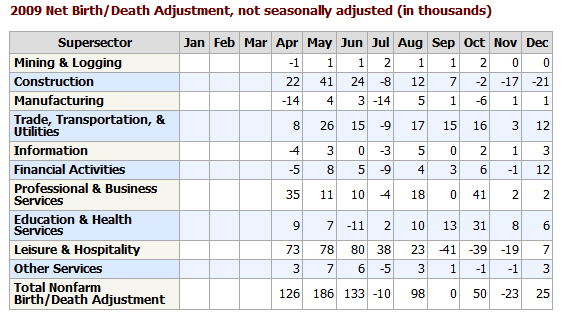
Birth Death Model Revisions 2009
Birth Death Model Revisions 2009
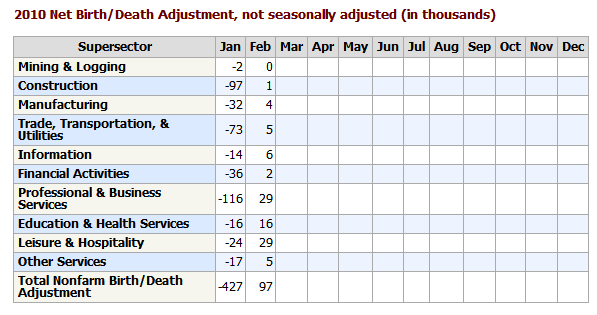
Birth/Death Model Revisions
The BLS Birth/Death Model methodology is so screwed and there have been so many revisions and up it is pointless to further comment other than to repeat a few general statements.
Please note that one cannot subtract or add birth death revisions to the reported totals and get a meaningful answer. One set of numbers is seasonally adjusted the other is not. In the black box the BLS combines the two coming out with a total. The Birth Death numbers influence the overall totals but the math is not as simple as it appears and the effect is nowhere near as big as it might logically appear at first glance.
The BLS added massive numbers of jobs every month to its model, all through the recession. Those jobs never existed. Last month the BLS made these revision to job totals to reflect errors in its Birth/Death model.
Birth/ Death Number for February 2010
The reported number for this month is +97,000 jobs. This early in the cycle, I highly doubt it. Nonetheless, the BLS will stick to its model, making back revisions as necessary, until its model is in alignment with reality.
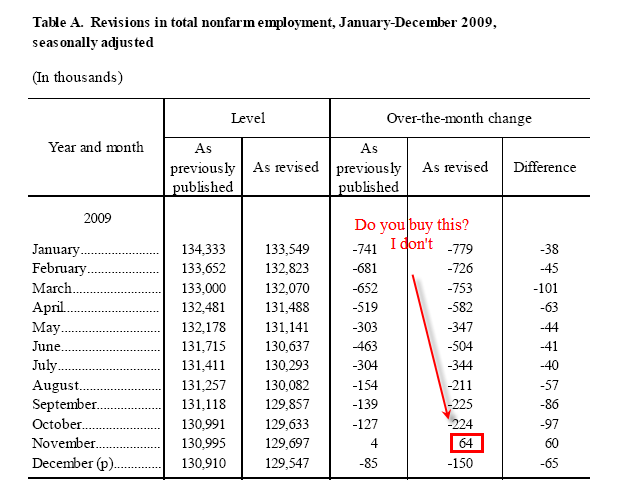
BLS Payroll Revisions
Household Revisions
The above table does not affect the unemployment rate. Revisions to the Household Survey do. Here are the household revisions.
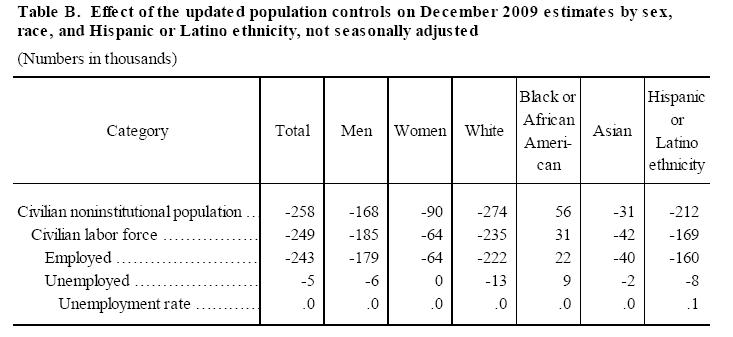
Bingo. Just like that the population shrank as did the civilian labor force.
BLS Black Box
For those unfamiliar with the birth/death model, monthly jobs adjustments are made by the BLS based on economic assumptions about the birth and death of businesses (not individuals). Those assumptions are made according to estimates of where the BLS thinks we are in the economic cycle.
Household Data
In February, the number of unemployed persons, at 14.9 million, was essentially unchanged, and the unemployment rate remained at 9.7 percent.
The number of long-term unemployed (those jobless for 27 weeks and over) was 6.1 million in February and has been about that level since December. About 4 in 10 unemployed persons have been unemployed for 27 weeks or more.
In February, the civilian labor force participation rate (64.8 percent) and the employment-population ratio (58.5 percent) were little changed.
The number of persons working part time for economic reasons (sometimes referred to as involuntary part-time workers) increased from 8.3 to 8.8 million in February, partially offsetting a large decrease in the prior month. These individuals were working part time because their hours had been cut back or because they were unable to find a full-time job.
Persons Not in the Labor Force
About 2.5 million persons were marginally attached to the labor force in February, an increase of 476,000 from a year earlier. (The data are not seasonally adjusted.) These individuals were not in the labor force, wanted and were available for work, and had looked for a job sometime in the prior 12 months. They were not counted as unemployed because they had not searched for work in the 4 weeks preceding the survey.
Among the marginally attached, there were 1.2 million discouraged workers in February, up by 473,000 from a year earlier. (The data are not seasonally adjusted.) Discouraged workers are persons not currently looking for work because they believe no jobs are available for them. The remaining 1.3 million persons marginally attached to the labor force had not searched for work in the 4 weeks preceding
the survey for reasons such as school attendance or family responsibilities.
Table A-8 Part Time Status
Note: many table numbers changed last month. Two months ago, and for as long as I remember, this used to be Table A-5.
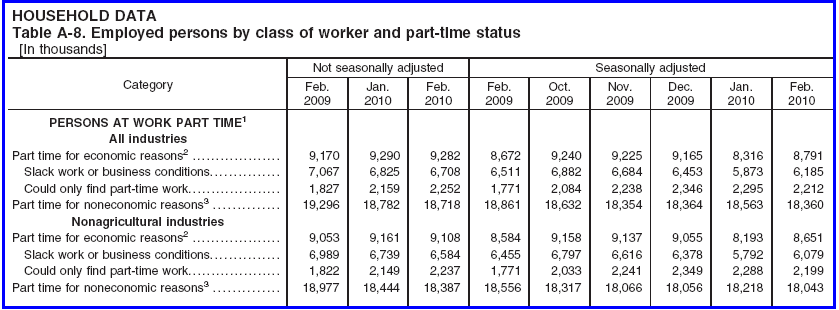
The chart shows there are 8.8 million people are working part time but want a full time job. A year ago the number was 8.7 million.
The key take-away is there are still millions of workers whose hours will rise before companies start hiring more workers.
Table A-15
Table A-15 is where one can find a better approximation of what the unemployment rate really is. Note: many table numbers have changed. Two months ago, and for as long as I remember, this used to be Table A-12.
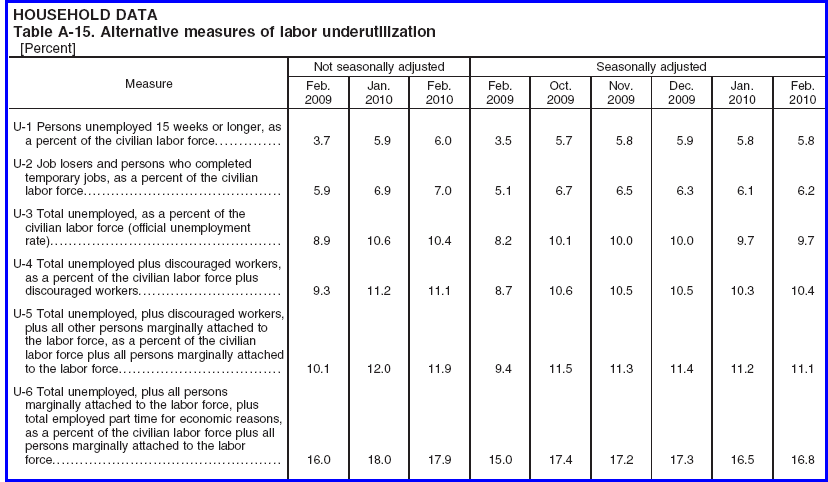
Grim Statistics
The official unemployment rate is 9.7%. However, if you start counting all the people that want a job but gave up, all the people with part-time jobs that want a full-time job, all the people who dropped off the unemployment rolls because their unemployment benefits ran out, etc., you get a closer picture of what the unemployment rate is. That number is in the last row labeled U-6.
It reflects how unemployment feels to the average Joe on the street. U-6 is 16.8%.
I believe both U-6 and U-3 (the so called "official" unemployment number) are poised to rise further although most likely at a much slower pace than last year.
Most economists expect to see the unemployment rate slowly drift lower. Time will tell which view is correct.
Looking ahead, there is no driver for jobs. Moreover, states are in forced cutback mode on account of shrinking revenues and unfunded pension obligations. Shrinking government jobs and benefits at the state and local level is a much needed adjustment. Those cutbacks will weigh on employment and consumer spending for quite some time.
Expect to see structurally high unemployment for years to come.
By Mike "Mish" Shedlock
http://globaleconomicanalysis.blogspot.comClick Here To Scroll Thru My Recent Post List
Mike Shedlock / Mish is a registered investment advisor representative for SitkaPacific Capital Management . Sitka Pacific is an asset management firm whose goal is strong performance and low volatility, regardless of market direction.
Visit Sitka Pacific's Account Management Page to learn more about wealth management and capital preservation strategies of Sitka Pacific.
I do weekly podcasts every Thursday on HoweStreet and a brief 7 minute segment on Saturday on CKNW AM 980 in Vancouver.
When not writing about stocks or the economy I spends a great deal of time on photography and in the garden. I have over 80 magazine and book cover credits. Some of my Wisconsin and gardening images can be seen at MichaelShedlock.com .
© 2010 Mike Shedlock, All Rights Reserved.
© 2005-2022 http://www.MarketOracle.co.uk - The Market Oracle is a FREE Daily Financial Markets Analysis & Forecasting online publication.