


Mitigating Collateral Damage
Stock-Markets / US Stock Markets Jul 30, 2007 - 09:27 AM GMTBy: Joseph_Russo

After numerous months of shaking and rattling, financial markets have finally begun to roll - - over, that is - and notably to the downside of late.
Financial engineers the world over, are likely scrambling alongside the brotherhood of institutions, deliberating plausible methods by which to orchestrate transfer of unintended, and immeasurable risks across the global financial sphere.
Over the decades, our globally adopted financial paradigms have spawned a plethora of derivative, and structured-finance schemes that are severely lacking in both foresight and prudence.
Perhaps the largest and most cunning of financially engineered schemes is the marriage of faith-based fiat-currency with a highly complex global credit system. This couple is no doubt, a quintessential source of far-reaching worldwide malaise.
Rarely spoken of in effectual context, nor adequately disseminated to the masses by mainstream media, our structurally flawed financial system may one-day stifle a notable portion of civil societies it has managed to create.
Given many of the non-transparent underpinnings to our modern systems of credit, currency, and money creation, one would be naive to embrace the notion that the financial realm is somehow separate from the economic realm.
Financial Armageddon : Global Revolution
The Coming Stabilization : The Next Great Wave
All in good time, we suspect. We realize it is plausible that the early warning signs of such malaise may be nearing critical mass. In kind, it may be just as likely that we have another 5 or 55 years grace to develop more structurally sound, and sustainable systems.
Considering the magnitude of the many systemic shocks endured in the past, our current system – flawed as it may be, has held up well. Relative to past shocks, the latest bout of market volatility appears nothing more than a minor irritation thus far.
One must also be cognizant that a horrific event of epic proportion need not occur in order for an overstretched, unsustainable structure to slowly build and multiply numerous layers of non-transparent fractures, breach, then suddenly implode - void of a singular cause. Bear in mind, the straw that breaks the camels back need not be heavy.
As the world continues to turn, we proceed with our work in monitoring progress to one of the most fascinating and deceptive Bull Markets in the history of humankind.
We close this piece by sharing a small segment of sentiment and breadth charts that we feature regularly in our Near Term Outlook Publication.
Each issue of the 30-page Outlook is packed with a full compliment of market internals, which measure various levels of impending strength and weakness across various broad based markets. Some indicators such as the VIX and PUT/CALL ratio are contrarian while others like Bullish Percents measure breadth and anticipate imminent market direction.
Upon the close of the trading week, we found recent readings in our Bullish Percents array to be of notable interest. We trust the thumbnail charts will speak for themselves.
Speaking of deception, the chart below provides a rather interesting overlay comprised of the Put/Call ratio, The Dow priced in Gold, and The Dow priced in US dollars.
Put/Call Ratio w/Dow vs Gold
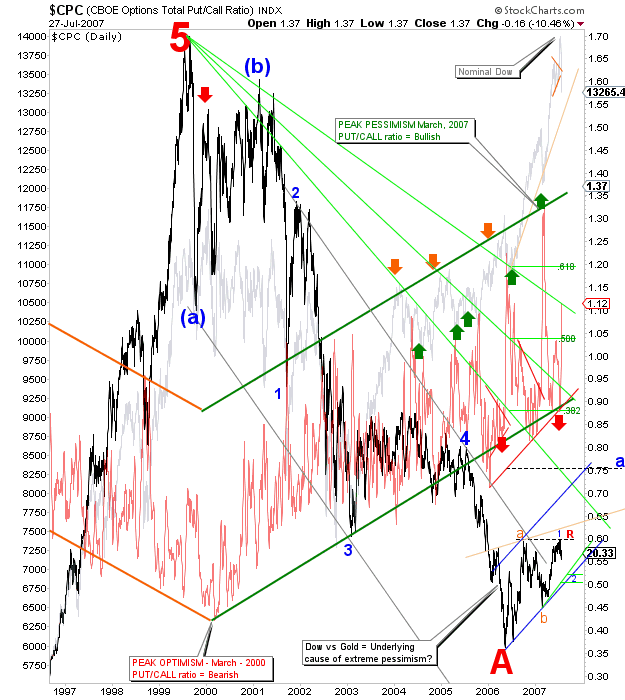
PUT/CALL Ratio: Based on CBOE statistics, the Put/Call Ratio equals the total number of puts divided by the total number of calls. When more puts are traded than calls, the ratio will exceed 1. As an indicator, the Put/Call Ratio measures market sentiment. When the ratio gets too low, it indicates that call volume is high relative to put volume and the market may be overly bullish or complacent. When the ratio gets too high, it indicates that put volume is high relative to call volume and the market may be overly bearish or in panic.
From peak optimism and complacency in March of 2000, the PUT/CALL ratio has been on a seven-year rising wave of pessimism. Interestingly, the ratio's high pessimism reading in 2002 was spot-on, and in perfect confluence with the nominal bear-market low in the Dow. Thereafter, in otherwise peculiar fashion, pessimism continued to accelerate amid a rising upward channel as the NOMINAL Dow staged a roaring bull market advance. We suspect the reason for the lopsided bearishness and pessimism is a direct result of artificially low rates of interest in concert with a ballooning of easy credit, reckless liquidity creation, and bloating fiat money supplies.
DOW vs Gold Ratio: The price series in black plots the Dow Jones Industrials as measured against the value of Gold. It is upon observation of this ratio that many analysts conclude that a “silent” bear market in stocks persists. This ratio appears to have reached a bottom of primary degree in 2006. If correct, a rising primary B-wave advance in the ratio would explain the persistent nominal move higher in the Dow concurrent with the weakness in Gold. From the ratios 2006 low, the Dow has outperformed Gold. We have plotted the “nominal” Dow in Grey
Bullish Percents
The Bullish Percent Index (BPI) is a popular market breadth indicator that is calculated by dividing the number of stocks in a given group (an exchange, an industry, etc.) that are currently trading with Point and Figure buy signals, by the total number of stocks in that group. Bullish Percent levels that are above 70% are considered overbought, whereas levels below 30% are considered oversold. Strong buy signals occur when the Bullish Percent Index falls below 30% and then reverses up by at least 6%. Conversely, promising sell signals occur when it goes above 70%, and then reverses down by at least 6%. As an aside, any 6% reversal from a prior pivot extreme raises near-term prospects for ensuing strength or weakness contingent upon the direction of the reversal.
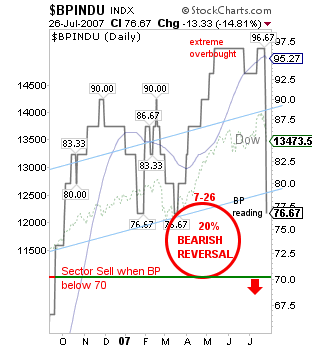
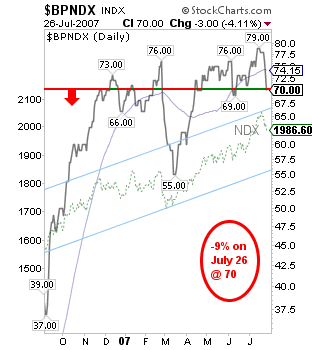
Dow Bullish percents NDX bullish percents
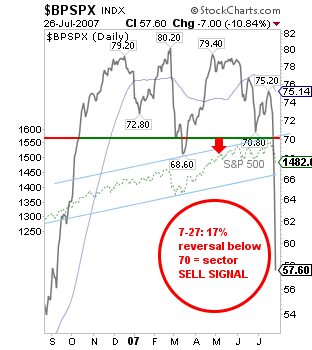
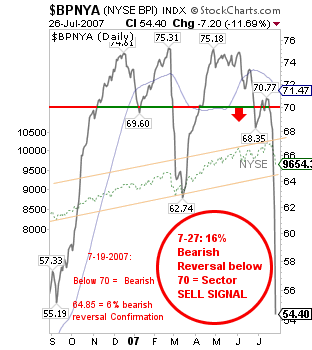
S&P 500 bullish percents NYSE bullish percents
Unless the rapid decelerations in BP levels are telegraphing an extreme washout panic-low, sector wide sell-signals in both the S&P and NYSE composite indices do not bode well for the bullish case over the near-term.
The sudden 20% bearish reversal in the Dow BP's is equally stunning. Of all the majors, the NDX escaped with least percentage reversal - though it threatens sector wide bearish confirmation upon a move below the 70 level.
Look for our regular market update for index traders in a separate post.
PS
Should you have interest in obtaining special access to Elliott Wave Technology's forthcoming blog-page, forward the author your e-mail address for private invitation.
Until next time …
Trade Better / Invest Smarter...
By Joseph Russo
Chief Editor and Technical Analyst
Elliott Wave Technology
Copyright © 2007 Elliott Wave Technology. All Rights Reserved.
Joseph Russo, presently the Publisher and Chief Market analyst for Elliott Wave Technology, has been studying Elliott Wave Theory, and the Technical Analysis of Financial Markets since 1991 and currently maintains active member status in the "Market Technicians Association." Joe continues to expand his body of knowledge through the MTA's accredited CMT program.
Joseph Russo Archive |
© 2005-2022 http://www.MarketOracle.co.uk - The Market Oracle is a FREE Daily Financial Markets Analysis & Forecasting online publication.