


The Past Year's Stock Market Rally Has Not Been Economically Driven
Stock-Markets / US Stock Markets Jul 28, 2007 - 12:28 AM GMTBy: Paul_L_Kasriel
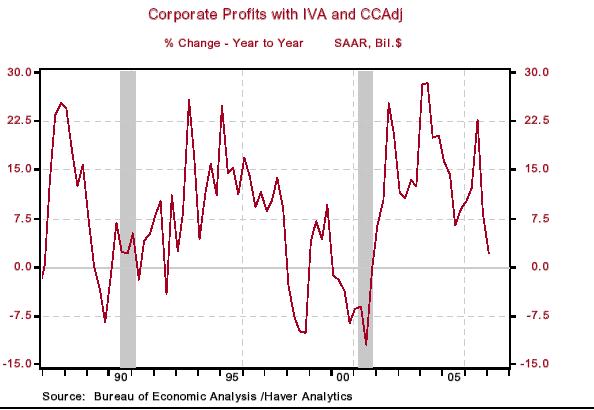
 What accounts for the 18.4% increase in the S&P 500 stock price index in the 12 months ended June 2007? Was it profit growth? Hardly. The Commerce Department's National Income and Product Accounts (NIPA) measure of corporate profits adjusted for prices (the GDP chain price index) shows the year-over-year change at minus 0.8% as of Q1:2007, the latest data available (see Chart 1). In nominal terms, year-over-year NIPA profit growth was only 2.1% in Q1:2007 vs. 10.1% in Q1:2006 (see Chart 2).
Chart 1
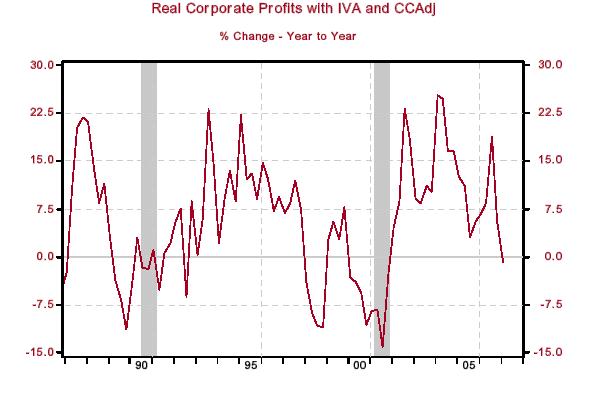
Chart 2
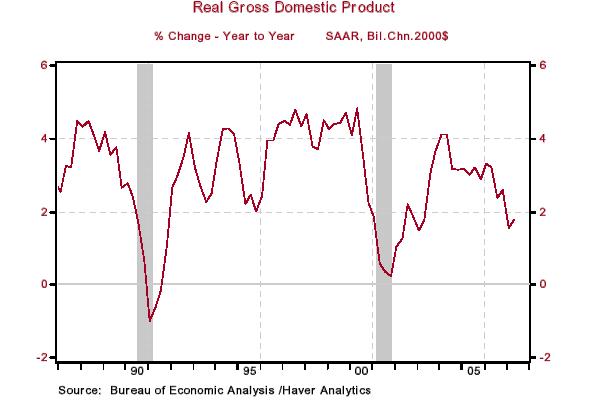
Real GDP growth has slowed significantly. On a year-over-year basis, real GDP was up only 1.8% in Q2:2007 vs. 3.2% in Q2:2006 (see Chart 3).
Chart 3
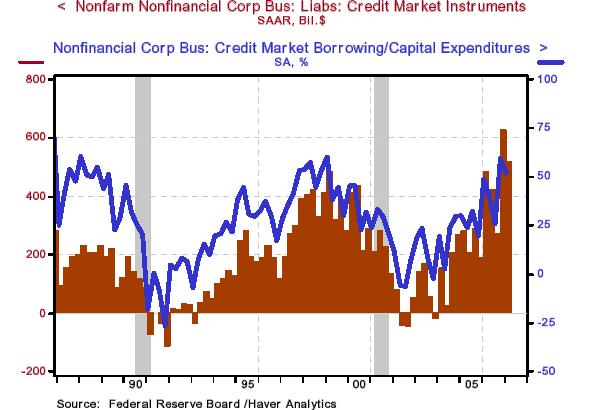
So, what has been driving U.S. stock prices higher? Massive buybacks of their own stocks by corporations and massive amounts of corporate stocks being purchased by private equity syndicates in taking publicly-traded companies private. And what has been driving this massive "de-equitization"? Cheap credit. Chart 4 shows that non-financial corporate borrowing has picked up in absolute terms and in relative terms - relative to capital spending.
Chart 4
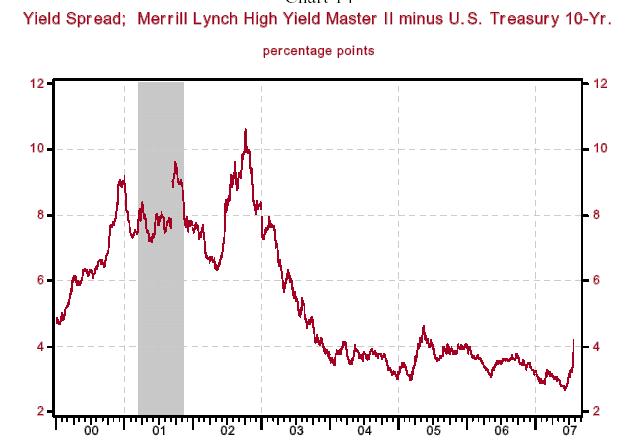
But now, credit to fund de-equitization is getting more expensive. Since June 12, the yield spread between high yield (aka junk) bonds and 10-year U.S. Treasury securities has increased by 150 basis points (see Chart 5). Even with this recent widening, corporate credit-risk spreads still are relatively low (see Chart 6). But should they continue to widen, this de-equitization factor that has been driving up stock prices will wane.
Chart 5
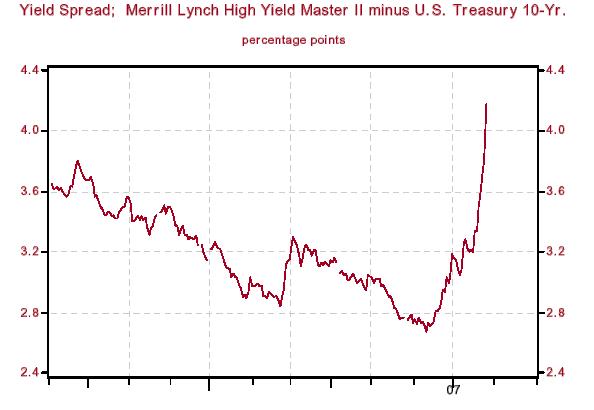
Chart 6
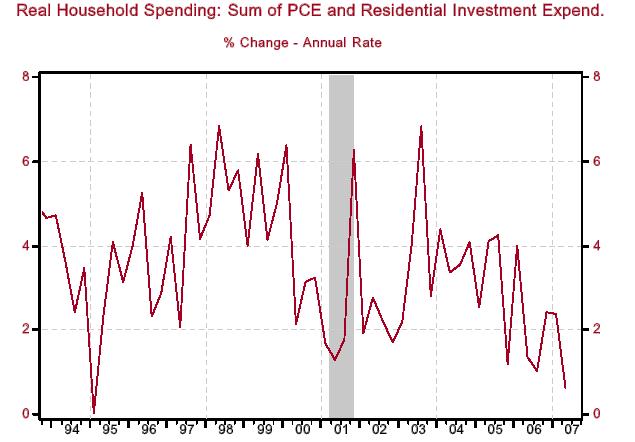
Would a significant slowdown in de-equitization have a negative impact on U.S. aggregate demand? You bet it would. As I argued in my latest The Econtrarian ( Wealth Effect or Borrowing/Asset Sales Effect? ), households have been net sellers of corporate equities (to corporations and private equity entities), the proceeds of which have been helping to fund household deficits. With the mortgage credit market tightening, a significant slowing in de-equitization would be another nail in the coffin of household spending, which accounts for 75% of real GDP. Perhaps the feeble 0.6% quarter-to-quarter annualized growth in real household expenditures (sum of real personal consumption and residential investment expenditures) in Q2:2007 - the weakest since Q1:1995 - is the new reality (see Chart 7).
Chart 7
By Paul L. Kasriel
The Northern Trust Company
Economic Research Department - Daily Global Commentary
Copyright © 2007 Paul Kasriel
Paul joined the economic research unit of The Northern Trust Company in 1986 as Vice President and Economist, being named Senior Vice President and Director of Economic Research in 2000. His economic and interest rate forecasts are used both internally and by clients. The accuracy of the Economic Research Department's forecasts has consistently been highly-ranked in the Blue Chip survey of about 50 forecasters over the years. To that point, Paul received the prestigious 2006 Lawrence R. Klein Award for having the most accurate economic forecast among the Blue Chip survey participants for the years 2002 through 2005.
The opinions expressed herein are those of the author and do not necessarily represent the views of The Northern Trust Company. The Northern Trust Company does not warrant the accuracy or completeness of information contained herein, such information is subject to change and is not intended to influence your investment decisions.
Paul L. Kasriel Archive |
© 2005-2022 http://www.MarketOracle.co.uk - The Market Oracle is a FREE Daily Financial Markets Analysis & Forecasting online publication.