Facts On US Housing Boom-Bust Cycles and Recessions
Housing-Market / Analysis & Strategy Dec 14, 2006 - 05:08 PM GMTBy: Jas_Jain
 No one denies that housing in the US has been cyclical with huge swings in the new construction as well as resale activity (both showing a high correlation with each other). Establishment no longer denies that there was a housing bubble during the past four years and that it has begun to burst. However, the establishment, led by the Federal Reserve, assures the public of a "soft-landing." Some even point to "the mid-cycle slowdown during 1995" without pointing out that there was no housing boom preceding that slowdown and, hence, no housing-led recession to follow.
Why the Boom-Bust Cycle?
It is a result of a highly combustible mixture of govt. intervention in the economy, via tax law changes that affect homeownership and sale of primary residence and very active Federal Reserve that keeps rates at artificially low levels only to have to take them too high to fight the resulting inflation, and the good old American promotionalism (there you go, I just coined a new term). Who cares for the refrains - beware of strangers (lawmakers and Federal Reserve) bearing gifts and take cover when you see an American promoter, especially, belonging to a highly organized group. The promoters in this case are well-known trade groups that help our lawmakers find ways to help American People with the American Dream. They are doing "Lord's work" in the material realm!
Quantification of Housing Boom-Bust Cycles
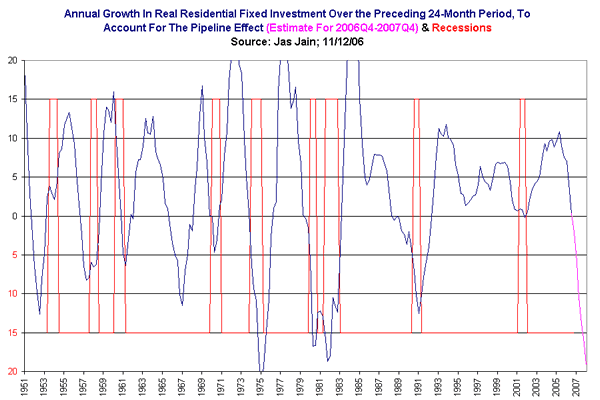
The easiest to quantify is the new construction of residential units. Residential Fixed Investment (RFI), in dollars, is reported as the part of the GDP report. Due to the pipeline of building approval for certain lands, permits, housing starts, etc., the activity does not end when the boom ends and it doesn't get into full swing for at least a year or two of the rise in demand from low levels. Therefore, I have found it useful to measure the rate of change of real (inflation adjusted) RFI over a two-year period. Fig. 1 shows the annual rate of change in real RFI over the preceding two-year period (the data is reported quarterly) superimposed with recessions.

First thing you will notice is that there are nine Housing Boom-Bust Cycles (HBBCs) and nine recessions. There are a couple of wrinkles and let me first iron out the wrinkles. The HBBC of 1965 was not followed by a recession. However, the YoY GDP growth rate fell by 6%! The economic growth rate during the 1960s was so red-hot that a 6% drop in YoY GDP growth rate didn't result in a recession. Under the current conditions of anemic growth at 3% it would lead to a deep recession. During 1980-82 there was only one giant HBBC and two recessions. What really happened was that when the economy came out of the recession during 1981 the RFI kept falling all thru that year and lo-and-behold the economy had to succumb to the housing. Not until the RFI started to recover in 1982Q4 that the economy finally came out of the recession. In addition to these two wrinkles there is a tiny spot that needs to be addressed. The recession of 2001 was the mildest one because the 2001 HBBC was the mildest one! The reason that the HBBC of 2001 was the mildest one was because there was no big boom preceding it and only a relatively flat RFI during 1999-2001.
Needless to point out that the housing downturns have preceded the recessions.
What Would the Economy Look Like Without the HBBCs?
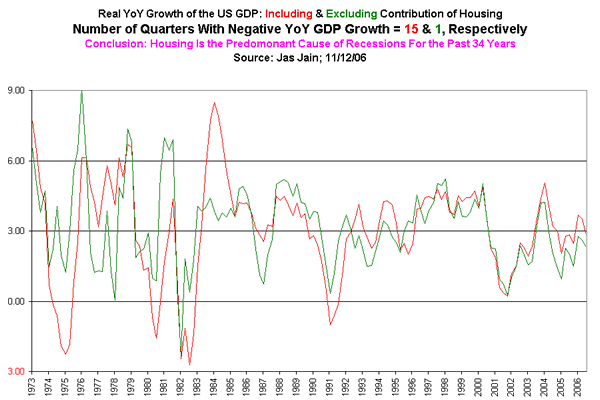
There are three significant economic activities that go hand-in-hand with the RFI - resale of existing homes, general boom in home improvements during a housing boom, and various expenditures, e.g., furnishings, that go with someone moving into a new home (not necessarily a brand new one). These activities, with reasonable assumptions, amount to 1.5-2 times the RFI. I can attest to a huge boom in major home improvements and additions in LA-Area over the past four years by people who didn't move into a new home. Fig. 2 shows the US GDP growth, as reported, i.e., including the housing, and the GDP growth excluding the housing by subtracting 2.75 times the RFI from the GDP.

As you can see from Fig. 2, the US economy would have been almost recession free for the past 34 years if it were not for the HBBC driven declines in the GDP growth. The three major recessions during 1974-1982 were NOT due to high oil prices resulting from the Arab Oil Embargo, but rather the good old American staple - HBBCs! This is particularly noteworthy during 1974-75 when the HBBC led downturn, having peaked in 1972Q2, subtracted 4% from the GDP growth. Not coincidently, the most brutal stock market (yes, back then it was not the Scam Market of today) bottoms, since 1950, were seen during these two HBBC led major recessions. Oh, BTW, those two housing booms had a lot to do with the demographics of Baby Doomers' household formations. The recent boom in McMansions might have been due to Baby Doomers building their own pyramids, or a Taj Mahal (a tomb). The coming Greater Depression would be characterized by Baby Doomers' household dis-formation (empty nesting)! The cycle must be completed. The Doomers were spoiled rotten as kids and will suffer miserably during their old age with neglect. There is absolutely nothing that America's economic Central Planners can do to forestall the doom. They are the ones who have paved the way.
Jas Jain, Ph.D.
the Prophet of Doom and Gloom
© 2005-2022 http://www.MarketOracle.co.uk - The Market Oracle is a FREE Daily Financial Markets Analysis & Forecasting online publication.


