More Stock Markets Selling Pressure Ahead Next Week
Stock-Markets / Global Stock Markets Jul 21, 2007 - 01:16 AM GMTBy: Mike_Paulenoff
With just an hour remaining in the session on Friday, I told subscribers to our Web site I was doubtful about the correction having ended, as I noticed the following:
Financial powerhouse Goldman Sachs (GS) remained down about 2.5% for the session, and more importantly, below its 200 DMA (208.31)...
Google (GOOG ) was still down 5% for the session, having bounced off of its 50 DMA (510.81) in the morning.
Spot gold was up about $18 since last Friday's close-- and was now trading 90% up the range for this week.
The iShares Lehman Brothers 20+ Year Treasury Bond (TLT) were holding in the upper 80% of the today's breakout advance.
The dollar was down a lot against the yen, and just off its (extrapolated) 12 year lows vs. the euro.
As it turned out, the early afternoon rally indeed had no legs. Instead of a rip-roaring, upside reversal finish, the major equity market ETF's, GS, et al, slipped a bit back towards the lower end of today's range, and the faded out completely, leaving me with the distinct sense that there is more selling pressure ahead early next week.
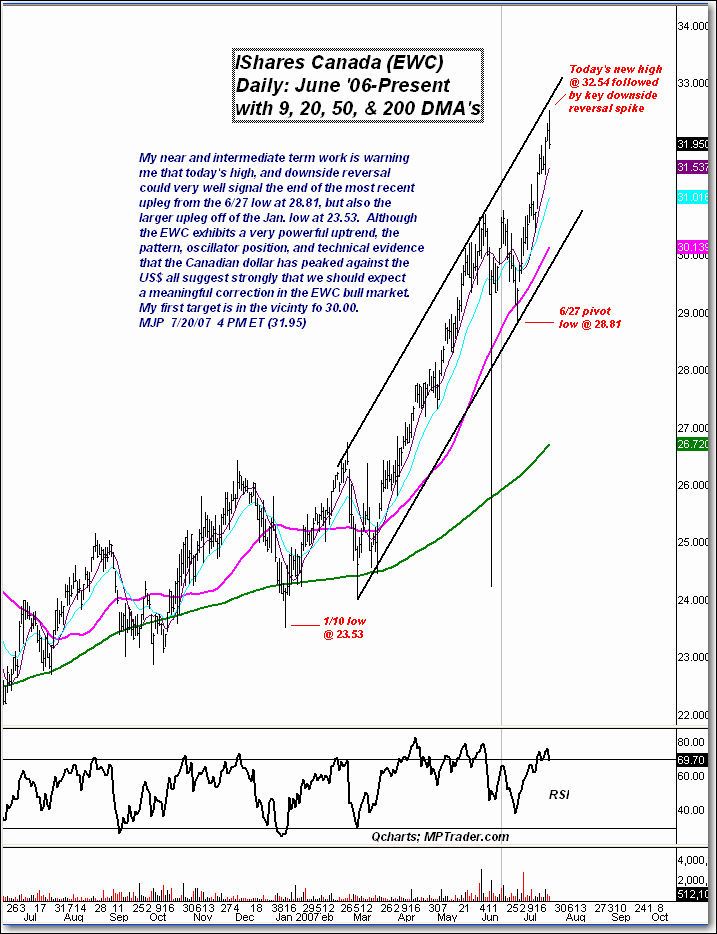
And not just in the U.S. markets. The iShares Canada ETF (EWC) on Friday registered a reversal off of new all-time highs. My near- and intermediate-term work is warning me that Friday's high, and downside reversal, could very well signal the end of the most recent upleg from the June 27 low at 28.81, but also the larger upleg off of the January low at 23.53.

Although the EWC exhibits a very powerful uptrend, the pattern, oscillator position and technical evidence that the Canadian dollar has peak against the U.S. dollar all strong suggest that we should expect a meaningful correction in the EWC bull market.
My first target is in the vicinity of 30.00.
Sign up for a free 15-day trial to Mike's ETF Trading Diary today.
By Mike Paulenoff
Mike Paulenoff is author of the MPTrader.com (www.mptrader.com) , a real-time diary of Mike Paulenoff's trading ideas and technical chart analysis of Exchange Traded Funds (ETFs) that track equity indices, metals, energy commodities, currencies, Treasuries, and other markets. It is for traders with a 3-30 day time horizon, who use the service for guidance on both specific trades as well as general market direction
© 2002-2007 MPTrader.com, an AdviceTrade publication. All rights reserved. Any publication, distribution, retransmission or reproduction of information or data contained on this Web site without written consent from MPTrader is prohibited. See our disclaimer.
Mike Paulenoff Archive |
© 2005-2022 http://www.MarketOracle.co.uk - The Market Oracle is a FREE Daily Financial Markets Analysis & Forecasting online publication.


