


Stock Market Update: Shortened Week Still Long on Profits
Stock-Markets / US Stock Markets Jul 08, 2007 - 01:25 AM GMTBy: Dominick
 For quite awhile now, I've hinted and even explicitly stated there would come a time I would don the proverbial bear suit and switch to fading rallies. But, because part of my unbiased trading style is the discipline to wait for confirmation, TTC members have had to forego really juicy doom and gloom forecasts and settle for trading both sides of the tape… and making money! As I've also said several times, successful trading has a huge psychological component, and keeping our heads in the game, in addition to hours of hard work, is a key factor of our ongoing wins.
Remember that last Friday ended with a selloff that took everyone by surprise, and had many screaming the top was in, again . It wasn't easy posting a chart that afternoon showing only a w2 low. But, that's what I saw and truly believed, so I went with it and seasoned members bought what turned out to be a head-fake low. In last week's update we stated the following:
That position is already in the green, but if we rollover on Monday morning and confirm a top was in, we'll be ready to put on the bear suit. But, baring any news timebombs next week, we don't think that'll be the case.
Looking at a chart of Monday morning's S&P open, you can clearly see that the trade was never in jeopardy. We gapped up Monday and basically trended up into Fridays close. Between the summer doldrums and the Fourth of July holiday, traders, and myself, were becoming restless watching and waiting for trades. The week basically drifted up like a hot air balloon. This typical summer trading might be something we need to get used to from here, but then again there's the strong possibility we're at an important juncture.
The Nasdaq faired even better this week, actually leading the markets and making a 6 ½ year high on Friday. The chart below is from last weeks update, as I was arguing the fact that this market was telling you additional highs were to be seen while most of the trading community only saw a top already in place. You should remember, and have profited very well, if you looked into last week's trade setup.
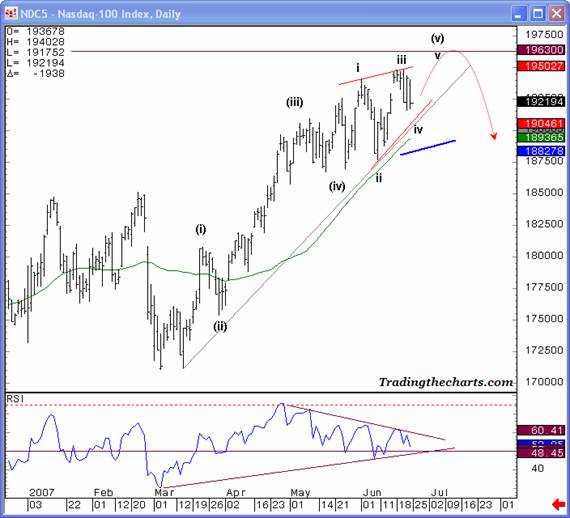
As expected, we achieved our low for wave 4, just where we thought it would be, and from there we did a moon shot of 90 points! Now the advance is to powerful to continue to label it as an ending diagonal, but that's okay, since we're on the correct side of that move. As I stated last week, if you had fallen into the trap of believing the markets had topped, you have no one to blame but yourself. This market was screaming at traders, but not many saw it or bothered to listen. Every one of our members were presented with this analysis and that's how even the newbies were able to be on the correct side of the trend for the last two weeks.
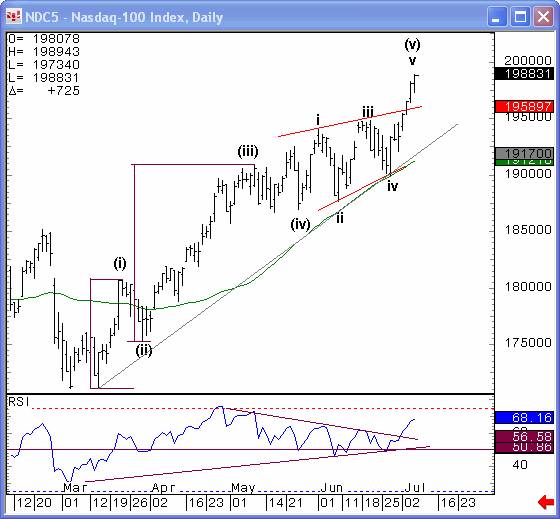
Now that we have reached our target in the Nasdaq, what will be in front of us? Well, we don't have the same situation in the Dow and S&P, but highs were made in both the Nasdaq and NYSE. With that, I feel that we are at a point where we can either get that blowoff/capitulation move, or buck the trend like we've been doing all along and finally this time take seriously the possibility of an important turn ahead of us while many others stay bullish. But that decision won't happen before next week as this week's volume was too light to give much credit to the advance. We do respect these levels, but I must say---It is time to SHOW ME THE MONEY! Otherwise, I might need to slip into my bear suit and you know there's plenty of dust on it.
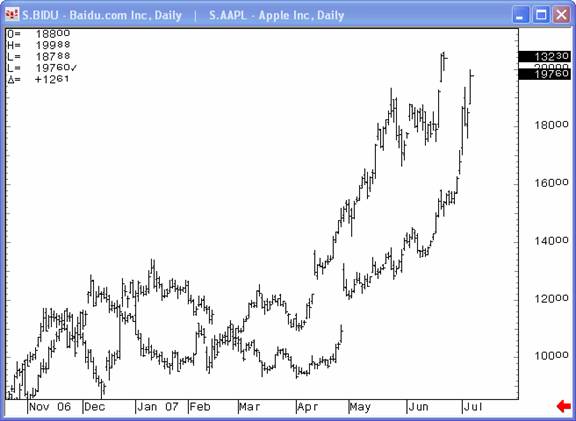
Another sign of a possible top looming is the run in momentum stocks. As seen in the chart below names like Apple, Research in Motion, Baidu, and Google bring back the feeling of 1999, especially seeing them rise in a parabolic move, like there's no tomorrow.
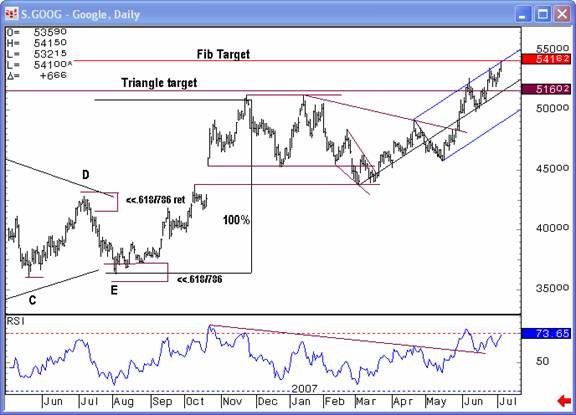
Speaking of Google, readers should remember this particular stock has been discussed many times in these updates. A year ago it was forming a contracting triangle which we showed a 125 point reward trade while only risking 3 points. Sure enough, Google never went under those 3 points and proved our analysis correct as it went to its target above $500. At that point, I made the statement that while Elliot Wave theory said the move was over, I had a problem believing that its proprietary Fibonacci target of $541.62 would not be hit. Since then it had traded down, as to be expected, but I continued to believe there would be another swing up to achieve that target.
Without any good Elliot Wave reason, this stock climbed its way back and Thursday nights close was one penny above the $541.62 target! Thursday was a big affirmation of what a friend told me many years ago, that the markets might be trading around the influences of Fibonacci levels and that we may be counting the waves price action leaves behind as it vibrates around these ratio projections. What Google does from here will tell me much more about the stock and in essence maybe what the Nasdaq might have in mind as well.
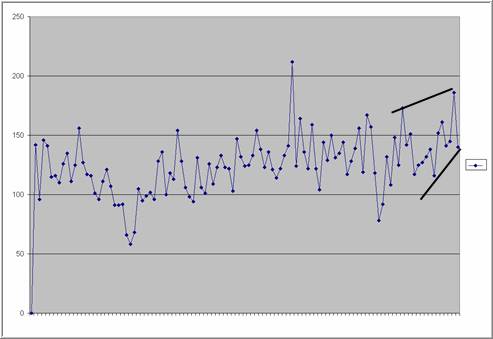
Over the past few months I've also continued to stress the importance of sentiment and that also, as of this week, has proven to be effective confirmation of important inflection points. As the chart below of Thursday's ISEE close shows, if we can continue to break out it will signal another important piece of what we are looking for.
Finally, we've also be curiously awaiting an important cycle in the market that goes back decades and comes due the week of July 23 rd . A couple other cycles are due at or about July 15 th , offering a roughly two week period where the market could be susceptible to a trend reversal. Considering these cycles and several other factors as a warning, we're ready to aggressively look for a top in the near future without sacrificing the willingness to stay long a market possibly approaching a blowoff top.
Since weekly readers do not have the liberty of being updated throughout the day, I must have you understand that as of this weekend this is not a call for a top in the markets, nor do I take such a call lightly. This is simply the prudent recognition of being within 30 points of long standing targets with some of the correct ingredients for a top starting to show up. Show me what I need and I will turn bearish, but not until then. Don't assume the markets will start heading down, particularly when I'd rather see them go up a bit more. Keeping an eye on news events at this point is wise as I believe there is a boogeyman out there that could set things in motion.
Whether you're currently a trader or investor, this, more than ever, is the time to join a community that has correctly called the markets since its inception 18 months ago. For the monthly fee of $89, you have access to technical analysis of most financial markets and commodities, a live chatroom, proprietary trend charts and much more.
To make things a no lose situation, join before June 13, 2007 and if you don't like it after a full week's try, send me an email asking for a refund, No questions asked .
Most members find the experience educational and many have explicitly said so. This testimonial below was just received this weekend and is one of many that I received showing what TTC does for its members.
Dom, I am now a 2 week newbie, and, generally speaking, a permabear. I am writing to let you know that I have made more profit in the 2 weeks since joining TTC than I did the first 5 months of 2007, and ironically, the majority of these profits came from the long side of the market. You have taught me some things about market movement in a short period of time that have allowed me to trade from the long side of the market with comfort (as much comfort as a permabear can have being long for more than a minute and a half!). For example, this morning when the market was selling off when I was long at 1534ish, and you posted the SPX cash chart with a probable turning point (my interpretation) at 1521.21, It permitted me to stay the course with a stop below that number, anticipating the rally. I thank you for providing the service of teaching us, and also setting for us to trade. IMHO, your service is a valuable asset for any trader, at a ridiculously low cost! Michael
Members
Be sure to visit the Weekly Maps. As many of you know, the Weekly Maps section of the site is where I lay out the big picture ideas for the following week along with charts from any other markets that seem to be playing a part in what we trade. And TRUST ME, the weeks ahead are important!
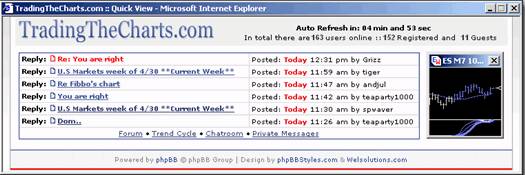
Also make sure you are aware of TTC's new addition to help many keep an eye on the Forum updates without needing to constantly login to check. We made this neat feature that you open to your desktop and you will be able to see when someone posts, and who is posting. There are some handy links there as well as a small time frame trend chart. I'm sure I'll find other things to add to it.
Have a profitable and safe week trading, and remember:
“Unbiased Elliott Wave works!”
By Dominick
For real-time analysis, become a member for only $50
If you've enjoyed this article, signup for Market Updates , our monthly newsletter, and, for more immediate analysis and market reaction, view my work and the charts exchanged between our seasoned traders in TradingtheCharts forum . Continued success has inspired expansion of the “open access to non subscribers” forums, and our Market Advisory members and I have agreed to post our work in these forums periodically. Explore services from Wall Street's best, including Jim Curry, Tim Ords, Glen Neely, Richard Rhodes, Andre Gratian, Bob Carver, Eric Hadik, Chartsedge, Elliott today, Stock Barometer, Harry Boxer, Mike Paulenoff and others. Try them all, subscribe to the ones that suit your style, and accelerate your trading profits! These forums are on the top of the homepage at Trading the Charts. Market analysts are always welcome to contribute to the Forum or newsletter. Email me @ Dominick@tradingthecharts.com if you have any interest.
This update is provided as general information and is not an investment recommendation. TTC accepts no liability whatsoever for any losses resulting from action taken based on the contents of its charts, commentaries, or price data. Securities and commodities markets involve inherent risk and not all positions are suitable for each individual. Check with your licensed financial advisor or broker prior to taking any action.
Dominick Archive |
© 2005-2022 http://www.MarketOracle.co.uk - The Market Oracle is a FREE Daily Financial Markets Analysis & Forecasting online publication.