Krugman, The Gold Standard and the Great Depression
Economics / Economic Depression Oct 30, 2009 - 05:21 AM GMTBy: Robert_Murphy
 Paul Krugman has concentrated his fire recently on those "thumping their chests" over the falling dollar. He has particular scorn for those recommending a return to the gold standard. In Krugman's view, a simple look at the historical facts will show that it was a superstitious fetish for the yellow metal that prolonged the Great Depression.
 A careful, comprehensive response to Krugman's charges would involve an explanation of the classical gold standard, and the wonderful peace and prosperity it showered on the world. It was only after the major countries abandoned gold during World War I that major imbalances in international trade began to fester — imbalances that eventually exploded during the early 1930s.[1] As a good capitalist pig, I point the reader to my book on the Depression for the full story.
Fortunately, we can take a shortcut in the present article. Using Krugman's own graph, we can see that the case for abandoning gold — and devaluing currencies in the process — is not nearly as straightforward as he seems to think.
Krugman's Graphical Case for Debasement
Here's Krugman setting up his graph. Note that the strikethrough, and accompanying text in the brackets, is from Krugman's post. What happened is that Krugman originally wrote one order of the countries going off gold, then a reader told him he was mistaken in the comments, so Krugman fixed his apparent error and explained this in brackets. I have included it as is below, because Krugman's bracketed explanation makes it crystal clear what his point is:
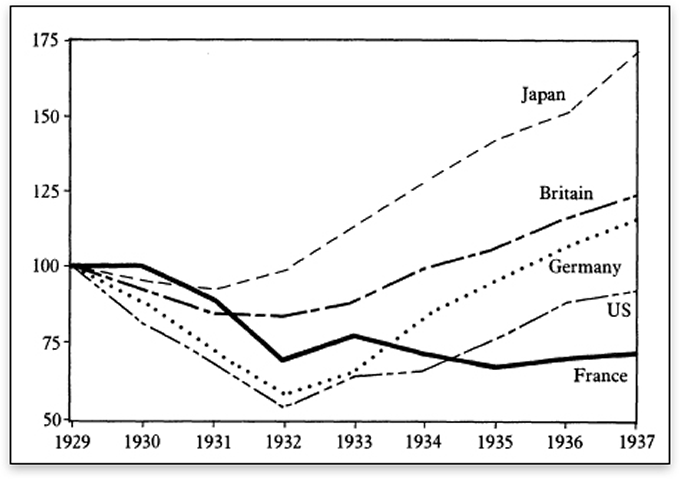
If there's one overwhelming lesson from the Great Depression, it is that putting a higher priority on stabilizing your currency than on domestic recovery is utterly disastrous. Barry Eichengreen pointed out years ago that major economies went off gold in the following order: Japan, Germany, Britain Britain, Germany, US, France. [screwed it up in the first draft: the correlation between going off gold and recovery is in fact perfect] And here's what happened to their industrial output….
Krugman reproduces a chart from this paper by Barry Eichengreen. This has been quite popular in the progressive blogosphere; indeed Brad DeLong features a modified version of it on the left margin of his main page. Here is the chart that apparently clinches the fact that the gold standard caused — or at least exacerbated — the Great Depression:
Inflation-Adjusted Industrial Output

Before moving on, let's be clear on why Krugman thinks the above chart is so damning to the goldbugs. By 1937, if you rank the nations' industrial output relative to 1929 levels, the order is Japan, Britain, Germany, the United States, and finally France. Now if you ask, In what order did countries abandon the gold standard? Why, the answer (Krugman tells us, after making the correction to his original post) is the same! So, this is apparently decisive evidence that abandoning gold was the way to get out of the Great Depression.
Quibbles With Dating
The first problem with Krugman's demonstration is that he's got his dates wrong. For example, Krugman himself reproduces the following correction from economic historian Peter Temin:
Germany went off gold before the UK in 1931, in July and August, that is, before late September when the UK devalued. The story however is a bit complex because Germany went off gold by eliminating the free flow of gold. They kept the value of the mark steady all through the Nazi period (see Adam Tooze's good book), but they controlled the flow of foreign exchange. The reason that this does not show up on your graph is that the German chancellor in 1931 (Bruening) followed the dictates of the gold standard in 1931, keeping interest rates high and deflating the economy. This is what I called the gold-standard mentality in Lessons from the Great Depression (1989).
So we already see nuances in the official story. Really, it's not tying a currency to gold per se that was the problem; the real problem was refusing to devalue a currency (which the gold standard made difficult).
But then we have another problem. In the chart, Japan is the best example. They apparently go off gold first, they have an almost immediate recovery, and they end up with the highest 1937 production. So here's my problem: Why do all these various sites (e.g. here and here) from Google tell me that Japan abandoned the gold standard in December 1931 — several months after Great Britain (in September 1931)?
Now, Japan had only gone back on gold the prior year, in January 1930, so maybe that's what Krugman's dateline is based on. In other words, whoever is telling Krugman that Japan went off gold first, might be dismissing the January 1930–December 1931 period as insignificant.
Be that as it may, all five of the countries under discussion were on a gold (exchange) standard as of January 1931. Then, if you ask in what order did they sever their currencies' ties to gold, the actual ranking is: Germany, Britain, Japan, the United States, and France.
Notice that the "perfect" correlation cited by Krugman has broken down significantly. Yes, the 4th and 5th countries go off gold end up ranked 4th and 5th, respectively, in terms of industrial output in 1937. But the other three countries are now ranked as if the correlation is precisely the reverse of Krugman's original claim. That is, the 3rd country to go off gold (Japan) is ranked 1st in output, the 2nd country to go off gold (Britain) is ranked 2nd in output, and the 1st country to go off gold (Germany) is ranked 3rd in output. If we just looked at those three countries, we would conclude that "history shows" abandoning the gold standard was the way to cripple your economic recovery.
Krugman can cite other policies if he wants. That's the tack Brad DeLong takes, when he titles his version of the chart to indicate that a country needs to go off gold and start its "New Deal" for the medicine to work. I'm simply pointing out here that it seems Krugman's history concerning dates of abandoning gold is just wrong. When the "pattern" really only works for three out of five countries, it's time to drop the particular argument and find a different one to make your point.
Does Industrial Output Really Respond to Devaluation?
Let's move beyond the quibbles over particular dates. If it turned out that Krugman's original ordering of historical devaluations were correct, would that give fans of the gold standard something to worry about?
Not really. Remember, the appeal of the above chart is that it seems to show that from 1929–1937, industrial output is proportional to the speed with which a country abandoned its currency's peg to gold. But what is so magical about 1929–1937? I think the only thing objective about it is that 1937 is the first year all of these countries had abandoned their peg.
If we lengthened the time frames, what would happen? After all, the Great Depression certainly wasn't over in 1937, so it's not clear that we're seeing the full story with Eichengreen's chart. I don't have convenient access to the raw figures, but it wouldn't surprise me if the ranking bounced around if you took a snapshot in 1938 or 1939. Naturally, the military situation in Europe would be relevant here — but then again, it was relevant in 1937 as well.
Even if we look at the data in the selected time frame, though, it's not obvious that abandoning gold should be credited with rescuing various countries' industrial output. Rather than simply comparing 1929 output to 1937 output, and then comparing the countries' ranking in this respect to the order in which they abandoned gold, we can use the above chart to see the allegedly beneficial effects of devaluation play out over time.
For example, Germany and the United States both experienced a significant rebound in (the annual average of) industrial output from 1932 to 1933. Krugman wants to credit the abandonment of gold with this feat. Yet France also experienced just as significant a recovery from 1932 to 1933, even though it stayed tied to gold until 1936.
So, although the chart plausibly shows the benefits to Japan and Britain for going off gold in 1931, it certainly doesn't show the benefits to the United States and Germany. Of course, Krugman could say that it was the United States and German recovery that lifted France as well — but that causality doesn't jump out from the chart itself. And Krugman was citing the chart as independent evidence of the stupidity of the gold standard.
Finally, let's look a little more carefully at the case of the United States. A critic of the gold standard looks at the chart above and concludes, "Sticking with gold drove the economy into the toilet, but once FDR freed the dollar from the peg in March 1933, it was smooth sailing."
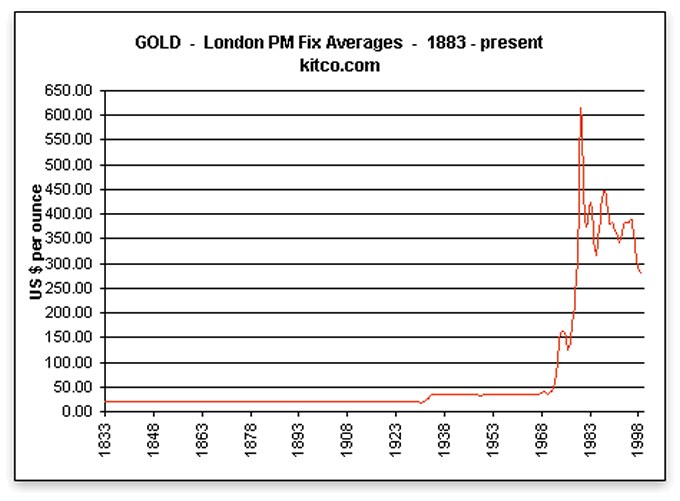
But no, that's not what the chart above shows. Before I can make the point, though, we need to clarify something: The United States abandoned the historical gold peg at $20.67 per ounce in March 1933 when FDR seized Americans' gold at gunpoint. Then, he literally set the gold price based on superstitions like "lucky numbers." (I explain these apparently crazy claims in my book.) But in 1934, the dollar was re-pegged to gold at $35 an ounce, where it stayed until that (allegedly) conservative free marketeer Nixon truly abandoned the gold standard in 1971. See for yourself:

So, with that historical information in hand, look again at Eichengreen's allegedly damning chart. Yes, the United States enjoyed a sharp recovery in 1933 relative to 1932 output. But it also enjoyed significant growth in 1935 and 1936, well after the dollar had been tied again to gold (at a lower parity). It's not obvious at all that it was the gold standard driving the movements of US industrial output during 1929–1937.
Why Going Off Gold Could Have Boosted Output
Remember that "abandoning gold" isn't akin to shaving one's mustache. When a country dropped a peg, it effectively ripped off every investor who had been holding assets denominated in it. Thus it's not surprising that some countries could experience apparent prosperity — especially if we just look at the short run — by abandoning gold.
For an analogy, someone who just bought an expensive house with no down payment, and who doesn't plan to apply for more loans anytime soon, could definitely gain a windfall by "abandoning his mortgage" (assuming the bank couldn't seize the property). That doesn't mean it's a shot in the arm for the economy. (Though of course, all analogies break down in our current crisis. The pundits really do think "abandoning mortgages" would be a good idea right now!)
Part of what happened in the 1930s was that the countries who stayed on gold were harmed when other governments reneged on their contractual obligations. For example, one of the smoking guns in the antigold case is that the Federal Reserve had to raise interest rates (after bringing them to unprecedented lows) in 1931, in response to Great Britain's abandonment of gold. What happened was that investors around the world feared the United States would follow Britain's example, and so they began redeeming their dollars for gold, thus draining US reserves. Hence, the Fed had to hike US interest rates to stem the outflow of gold.
Inflation Can Help If the Government Is Propping Up Wages
Another major factor is that governments in the 1930s were interfering with wages and prices more so than at any prior point in (peacetime) history. For example, after the 1929 stock-market crash, President Herbert Hoover began a series of conferences with big business and labor leaders, telling them that cutting wage rates (the standard response in previous depressions) would be disastrous, because then the workers wouldn't make enough to buy the products.
This meant that nominal paychecks fell much more slowly during the early years of the Great Depression than the general price level. Consequently, if you kept your job, you experienced a higher increase in real (inflation-adjusted) wages during the early 1930s, than during the Roaring 1920s! So, it's no wonder that unemployment reached record highs during Hoover's first and only term. If a president wants to get a huge glut on the labor market during his administration, textbook economics says to prop up wages above their market-clearing level.
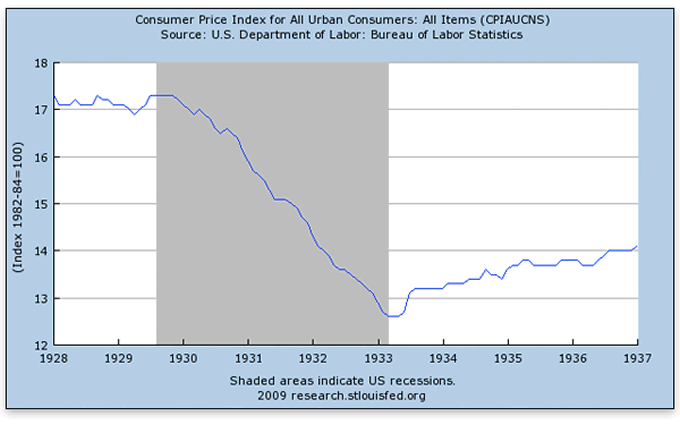
Now in this context, when FDR reneged on the US government's promise to redeem dollars for gold, it allowed the Federal Reserve to flood the economy with new dollars. The falling price level turned around on a dime, as this chart indicates:

Generally speaking, printing up green pieces of paper doesn't make an economy more productive; it merely redistributes the existing property while making it harder to plan for the future. But, if the government is also preventing wage rates from falling to their new, market-clearing level, then inflating the currency has the benefit of reducing unemployment.
Of course, this observation is no justification for what FDR did. Had prices and wages been left to the market, the recovery would have been swift, just as it was in the 1920–1921 depression. Even so, fans of the gold standard need to understand why the economy apparently recovered so quickly after FDR devalued the dollar.
Conclusion
Intuitively, it makes no sense to say that the major dislocations of the world's economies in the 1930s could have been solved simply by printing up pieces of paper. When we closely examine the graphical evidence that apparently proves this strange claim, we see it falls apart. Krugman and Friends need to convince us, first, that their history is accurate, and second, that their charts really prove what they claim.
Robert Murphy, an adjunct scholar of the Mises Institute and a faculty member of the Mises University, runs the blog Free Advice and is the author of The Politically Incorrect Guide to Capitalism, the Study Guide to Man, Economy, and State with Power and Market, the Human Action Study Guide, and The Politically Incorrect Guide to the Great Depression and the New Deal. Send him mail. See Robert P. Murphy's article archives. Comment on the blog. ![]()
Notes
[1] The First World War would not have lasted nearly as long had governments been forced to pay for it exclusively through taxation or borrowing. Suspending their currencies' ties to gold allowed the major belligerents (except the United States) to finance the war effort with inflation as well. (The Federal Reserve also inflated to pay for the war, though it was constrained because the United States remained on the gold standard.)
© 2005-2022 http://www.MarketOracle.co.uk - The Market Oracle is a FREE Daily Financial Markets Analysis & Forecasting online publication.


