Dow Could Go to 13,000. But Will Likely Reverse (Suddenly) By More Than 20%
Stock-Markets / Articles Oct 20, 2009 - 07:21 AM GMTBy: Andrew_Butter
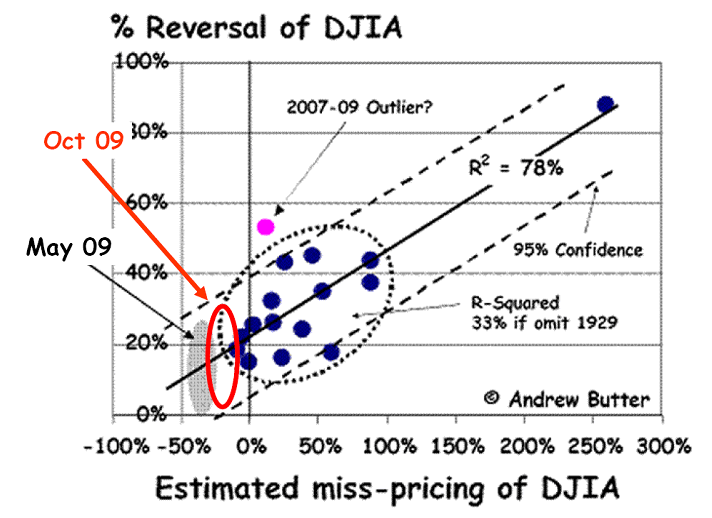
 This is the analysis used to predict in May that the Dow would reach 10,000 without a major reversal, (personally I didn’t expect then that it would happen so quickly).
I’ve put on my estimate of where I reckon it is now (in red).

It’s approaching the “danger zone” (dotted black ring), although reversals when the mispricing is negative tend to be more restrained.
That analysis was based on two lines of logic, the first is to calculate what International Valuation Standards calls “other-than-market-value” (some people call that “fundamentals” but since so many people have so many opinions on what that is I don’t use that word, and I do it strictly in accordance with IVS with some don’t).
Second that the extent of mispricing after a bubble is a direct function of the extent of the previous mispricing, my model essentially measures the “pressure” of the “Tectonic Plates”, and the amount of pressure released appears in the past (stock markets, housing markets and it looks like oil to me), appears to be historically in proportion to the extent of what George Soros calls “disequilibrium” of the preceding bubble.
One comment I got back was “this is the worst piece of analysis I have ever seen”.
That is a perfectly valid and understandable opinion, particularly since this is a totally new way of looking at stock markets (but not valuation – that’s what I do), all I can say in response is “OK, but regardless, it gave the right answer”.
Also that’s the analysis I used to predict that the S&P 500 would bottom once it reached 675 (in January) which it did on 6th March and that was the bottom. Of course I could have just been lucky, but so far that approach has been “lucky” (i.e. within 1%), three times in a row; and I suppose, like James Bond said once, “one shot in your direction could be an accident, two is suspicious, three, is enemy fire”.
What surprised me was how fast if fell from about 850 to 675 or so, the initial analysis said not for a year or more (at the time everyone was saying the bottom was in, my main point at the time was that the bottom was not in), in February I revised the timing although I still was thinking months not weeks.
On reflection, mainly based on looking at the pattern of the bust after 1929, I’m coming around to the idea that the US stock markets will be under-priced for another ten years or so (my calculation says the “right” price now is about 1,500 on the S&P 500 but the garbage of the past ten years of cronyism has to be flushed down the toilet before the market is not mispriced down).
I suspect that may have a lot to do with companies that are simply not viable without a bubble, holding on, playing accounting games, denying reality, and hoping the government creates another bubble, I’d put a lot of the Wall Street banks in that category, currently they survive by the “forbearance” of the regulators (they call that “Stress Tests”), accounting gimmicks, and the benevolence of the Fed that lends them money at 0% or so, so that they can buy Treasuries at 4% (and perhaps speculate on the stock market or in commodities), as if that creates long term economic value (socially useless is how the head of the bank of England described it)).
And in the end the taxpayer pays, either via the National Debt or inflation.
I suspect that a lot of the speed of the increase in the market was thanks to the Fed creating money for speculators to play with, clearly the penny still didn’t drop that creating bubbles, even if it’s to get yourself out of a bind that you created, is zero sum and because of efficiency losses actually destroys economic value.
So I wouldn’t be surprised to see the Dow going up to 13,000 in six months, although the higher it gets the harder it will fall, so if the bust comes before 12,000 it might be 20% down (coming back to 9,500), if it gets to 14,000 it could be 40% (coming back down to 8,500). If it stays under 11,000 I’d say a reversal (i.e. more than 10%) is unlikely.
There is no guarantee that the Fed won’t keep inflating the mini-bubble that is in danger of being created, until it pops. That appears to be what they do best, then when “surprise” it all goes wrong they panic.
Also the fact that other investment opportunities are limited or risky, even traditionally “safe” options like Treasuries and Commercial Property (and housing), means there is a lot of money lying around with nowhere to go.
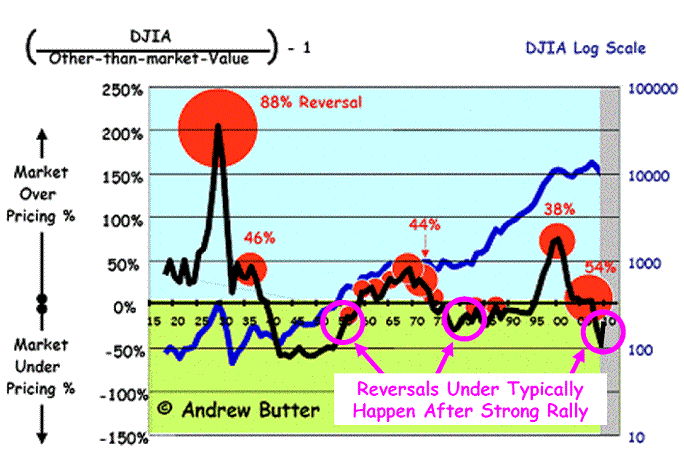
Looking at the pattern after 1929 and 1971 (both times a bubble popped – in 1971 helped by the Arab oil Embargo), typically there are FOUR reversals before equilibrium is reached again (i.e. one main shock then three after-shocks).
In this case the Dot.com Bust was #1, the second was September 2008 plus down to March 2009 (that’s one bust), based on history there are two more (biggish ones i.e. 20% to 40%) to come over the next three to six years.
I have no strong opinion on when or what the trigger will be, although an oil-price bubble (popping) or a dramatic increase in the long term Treasury rates are likely contenders.
All my analysis does is measure “pressure” and general direction; but I suspect that the next six months will be a good time for traders who understand the short term to do some surfing (I don’t).
That said, looking in the past, the “trigger” for a reversal appears to be a period of rapid consolidation (as happened recently):

I’d say the next six to nine months will be harder to make money in the US stock market than it was over the past six months when everything went up, quality is probably much more important now that it was then; and the risk-reward is less persuasive, I’d be amazed to see 14,000 by this time next year, that’s +40% but not at all surprised to see 9,000 (-10%), time perhaps to look at other opportunities?
One I like is commercial property in USA, that looks getting to be pretty well cooked by now, but you need to know what you are doing there and there are not many people who do (i.e. who were smart enough to make money out of that sector in 2008, that’s an acid test), and it’s not a get-rich-quick play, more like capital preservation (with a decent return if you get it right).
By Andrew Butter
Andrew Butter is managing partner of ABMC, an investment advisory firm, based in Dubai ( hbutter@eim.ae ), that he setup in 1999, and is has been involved advising on large scale real estate investments, mainly in Dubai.
© 2009 Copyright Andrew Butter- All Rights Reserved
Disclaimer: The above is a matter of opinion provided for general information purposes only and is not intended as investment advice. Information and analysis above are derived from sources and utilising methods believed to be reliable, but we cannot accept responsibility for any losses you may incur as a result of this analysis. Individuals should consult with their personal financial advisors.
Andrew Butter Archive |
© 2005-2022 http://www.MarketOracle.co.uk - The Market Oracle is a FREE Daily Financial Markets Analysis & Forecasting online publication.


