UK Treasury Bond Market, Surging Gilts Sleep Walking Toward Edge of a Cliff
Interest-Rates / UK Debt Oct 02, 2009 - 05:05 AM GMTBy: Seven_Days_Ahead
 The Gilt has remained well-supported over recent months despite some of the worst public sector borrowing data ever seen, and certainly in peace time. In recent days it has begun to surge -in line with or even better than other bond markets What then, as we have asked before, keeps this market up?
Apart from the Bank of England’s QE program, what other special quality does the gilt posses that allows the UK government to push the debt to GDP ratio from around 39% to a projected 70% in such a short period of time?
For sure, these are difficult times and this recession in many ways has been like nothing else in living memory. But usually when economies start to recover, government bond yields start to rise as investors begin to seek greater rewards in other asset classes, usually equities. Moreover, the fear of collapsing growth is replaced by concerns that inflation may rear its ugly head if monetary policy isn’t tightened in a timely manner.
Right now in the UK official interest rates are effectively at zero and the Bank of England has printed £175.0B of new money. That is money that hasn’t been created as a result of an increase in productive capacity, but by turning on a printing press. This has been done with the sole aim of warding off deflation and encouraging inflation.
But the UK economy is showing definite signs of improving, with the housing market apparently springing back to life and the dominant service sector of the economy recording expansion for several months, via the PMI Services survey. But still the Bank seems far from tightening policy as policy makers are suspicious the recovery may yet prove a false dawn.
In addition, the Bank now seems content to see the value of the Pound slide. This in itself should worry international investors as the money they are investing in UK Gilts is eroding in value, but still the Gilt refuses to bend.
Another consideration is the apparent commitment by this government and the opposition parties to cut public spending by half over four years starting after next year’s general election.
Coming from the opposition Conservative party the pledge seems credible as they have opposed the massive build up of debt and when they were last in government they made difficult choices over public spending. But coming from the incumbent Labour party the pledge is less convincing, unless Gordon Brown has had his own equivalent road to Damascus conversion - which we do not believe.
More likely, the markets too are sceptical of the UK economic recovery and continue to prefer the relative safety of UK government debt which remains AAA rated. Their reasoning may be that if the UK government defaults, then other asset classes and sovereign issuers are likely to be in a similar predicament and with inflation looking tame and expected to remain so for quite some time, at least by the Bank of England, they see little risk in holding Gilts.
But what if the recovery in the housing market proves durable? What if the PMI Services survey is accurately predicting the strength of the recovery? What if the Bank of England is wrong and they have pumped too much liquidity into the economy?
The Bank will have to act fast and aggressively with policy and this market together with Short Sterling will be a big sell.
In the US in less than a week two prominent Fed members have briefed about the need for the Fed to act before action appears needed. In the Euro zone the ECB has reported a substantial drop in the liquidity demands of Euro zone Banks.
In short, the global economic environment is improving and that includes the UK so Gilt traders might just be sleep walking towards the edge of a cliff.
The Technical Trader’s view:
 |
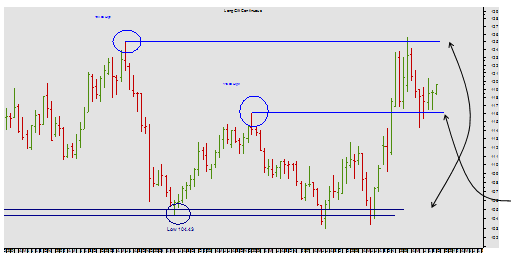
DAILY CHART The monthly continuation chart’s structure is clear enough: a clear trading range, within which the market has found support at the Prior High at 115.08. Look closer. |
|
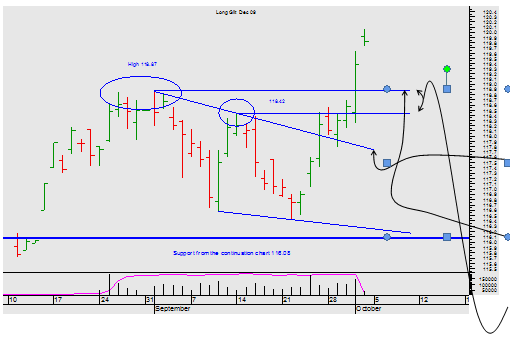
DAILY DEC 09 CHART The December chart makes a convincing case that the market may go further still. The bull falling wedge has completed, and the market has overcome the Prior High at 118.87 in some style. Use that band 118.42- 118.87 as good support on any pull-back…. The market looks well-set short-term yet still remains within a well-defined trading range in the medium-term. |
Mark Sturdy
Philip Allwright
Seven Days Ahead
Be sure to sign up for and receive these articles automatically at Market Updates
Mark Sturdy, John Lewis & Philip Allwright, write exclusively for Seven Days Ahead a regulated financial advisor selling professional-level technical and macro analysis and high-performing trade recommendations with detailed risk control for banks, hedge funds, and expert private investors around the world. Check out our subscriptions.
© 2009 Copyright Seven Days Ahead - All Rights Reserved
Disclaimer: The above is a matter of opinion provided for general information purposes only and is not intended as investment advice. Information and analysis above are derived from sources and utilising methods believed to be reliable, but we cannot accept responsibility for any losses you may incur as a result of this analysis. Individuals should consult with their personal financial advisors.
Seven Days Ahead Archive |
© 2005-2022 http://www.MarketOracle.co.uk - The Market Oracle is a FREE Daily Financial Markets Analysis & Forecasting online publication.


