


Wave of Unemployment in the U.S. What to Expect and What to Do
Economics / Recession 2008 - 2010 Sep 10, 2009 - 03:55 AM GMTBy: Washingtons_Blog

 Individuals who look for work but can't find it are miserable.[1]
On the national level, high unemployment is both cause and effect concerning other problems with the economy. As we'll see below, high unemployment results from a weak economy and - in turn - weakens the economy.
 Until the causes of, and solutions to, high levels of unemployment are understood, we will not be able to solve the problem.
How High is Unemployment?
Before we can even start looking at causes or solutions, we have to understand what the current level of unemployment really is, and what the trends portend for the future.
Let's use America as an example. With the largest economy in the world, it has often been said that "when America sneezes, the rest of the world catches cold". And much of the rest of the world has adopted the "Washington Consensus" - America's neoliberal view of economics.[2] Moreover, the rest of the world has been infected by many types of "toxic assets" invented in America, such as credit default swap derivatives[3], as well as Wall Street style banking strategies. So I will use the United States has a case example, but will also touch on global trends.
Official figures put unemployment in the United States somewhere between 9 and 10 percent. But the official figures use a very different measure for unemployment than was used during the Great Depression and for many decades afterwards.
Specifically, the official unemployment reports of the Department of Labor's Bureau of Labor Statistics (BLS) provide conventional "U-3" figures and various alternative measures including "U-6". [4]
For example, as of December 2008, U-3 unemployment was 7.2 percent, while U-6 was 13.5 percent. [5]
U-6 is actually more accurate, because it includes those who would like full-time work, but can only find part-time work, or have given up looking for work altogether.
As can be seen by the December 2008 figures, U-6 unemployment rate can almost double the more commonly-cited U-3 figures.
But those in the know argue that the real rate is actually even higher than the U-6 figures.
For example, Paul Craig Roberts [6] - former Assistant Secretary of the Treasury and former editor of the Wall Street Journal - and economist John Williams both said in December 2008 that - if the unemployment rate was calculated as it was during the Great Depression - the December 2008 unemployment figure would actually have been 17.5%.
Williams says [7] that unemployment figures for July 2009 rose to 20.6% [8].
According to an article [9] summarizing the projections of former International Monetary Fund Chief Economist and Harvard University Economics Professor Kenneth Rogoff and University of Maryland Economics Professor Carmen Reinhart, U-6 unemployment could rise to 22% within the next 4 years or so.
As the New York Times pointed out in July[10] :
Include [those who have given up looking for a job and those part-time workers who want to be working full time] — as the Labor Department does when calculating its broadest measure of the job market — and the rate reached 23.5 percent in Oregon this spring, according to a New York Times analysis of state-by-state data. It was 21.5 percent in both Michigan and Rhode Island and 20.3 percent in California. In Tennessee, Nevada and several other states that have relied heavily on manufacturing or housing, the rate was just under 20 percent this spring and may have since surpassed it.
Indeed, the chief of the Atlanta Federal Reserve Bank -Dennis Lockhart - said in August 2009:
If one considers the people who would like a job but have stopped looking -- so-called discouraged workers -- and those who are working fewer hours than they want, the unemployment rate would move from the official 9.4 percent to 16 percent. [11]
Former Labor Secretary Robert Rubin notes:
Over the past three months annual wage growth has plummeted to just 0.7%. At the same time, furloughs -- requiring workers to take unpaid vacations -- are on the rise: recent surveys show 17% of companies imposing them. [12]
Temporary employment is still falling as well. [13]
And economist David Rosenberg points out:
65% of companies are still in the process of cutting their staff loads...
The Bureau of Labor Statistics also publishes a number from the Household survey that is comparable to the nonfarm survey (dubbed the population and payroll-adjusted Household number), and on this basis, employment sank — brace yourself — by over 1 million, which is unprecedented...[14]
In addition to the failure of official BLS unemployment figures to take into account discouraged and underemployed workers, many analysts argue that BLS' "Birth-Death Model" severely understates unemployment during recessions. [15]
Many people - including economists and financial reporters - say that unemployment is much lower than it was during the Great Depression. What they mean when they say that is that current U-3 figures in America are under 10%, while unemployment hit 25% during the Great Depression.
But most people forget that the worst unemployment numbers during the Great Depression did not occur until years after the initial 1929 crash . Specifically, unemployment did not hit 25% until at least 3 years after the start of the Depression.[16]
As of this writing (2009), we are only a year into the current economic crisis. Therefore, we have at least 2 more years to go until we hit the same period that unemployment peaked during the Great Depression.
Indeed, former Secretary of Labor Robert Reich wrote in April that the unemployment figures show that we are already in a depression.[17]
And Chris Tilly - director of the Institute for Research on Labor and Employment at UCLA - points out that some populations, such as African-Americans and high school dropouts, have been hit much harder than other populations, and that these groups are already experiencing depression-level unemployment.[18]
Assuming that Williams, Roberts or Lockhart's calculations of unemployment are correct (using the same methods of measuring unemployment as were used during the Great Depression), and depending on when we deem the current crisis to have commenced, then - as shown by the following charts - unemployment percentages may actually be worse than they were during a comparable period in the Great Depression:
[19 and 20]
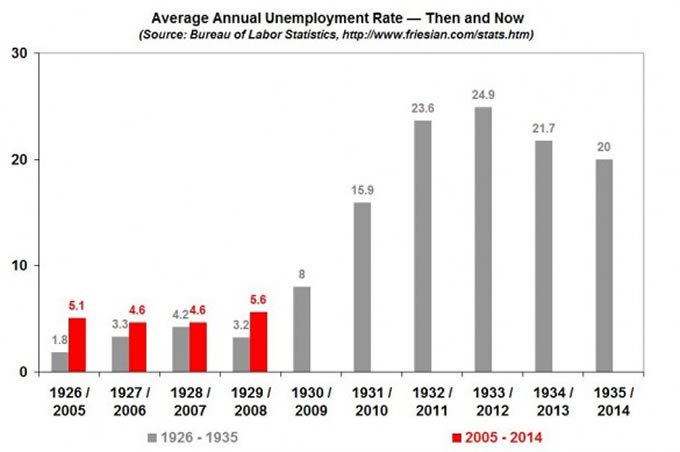
We also know that, in terms of total numbers of unemployment people (as opposed to percentages), more people will be unemployed than during the Great Depression. [22]
What Are the Unemployment Trends?
If unemployment is anywhere near as bad as during a comparable period during the Great Depression, the obvious question is where the trends are heading.
It is well known among economists that unemployment is a "lagging" indicator. [23] In other words, there is a lag time. When the economy hits a rough patch, the economic weakness will not show up in the unemployment numbers until several months or years later.
For example, as Europe’s largest bank - RBS - warns:
Even if the economy starts to turn up the headwinds will be formidable,” [the company's CEO] warned. “The green shoots are short in duration and you need to be cautious about interpreting them. Even if growth returns, unemployment will rise for some time afterwards ...[24]
Because of the lag time between conditions in the economy and unemployment, we have to ask the following two questions in order to forecast future unemployment trends:
1) How bad were conditions in 2008 and early 2009?
and
2) What will economic conditions be like in the future?
How Bad Did It Get?
Unfortunately, many experts - including the following people - have said that the economic crisis which started in 2008 could be worse than the Great Depression:
-
Federal Reserve chairman Ben Bernanke said on July 26, 2009:
A lot of things happened, a lot came together, [and] created probably the worst financial crisis, certainly since the Great Depression and possibly even including the Great Depression. [25]
-
Economics professors Barry Eichengreen and and Kevin H. O'Rourke said that world-wide conditions are worse than during a comparable period during the Great Depression [26] (updated in June 2009 [27])
-
Investment advisor, risk expert and bestselling author Nassim Nicholas Taleb said that the current crisis could be "vastly worse" than the Great Depression [28]
-
Former Fed Chairman Paul Volcker believes the current crisis may be even worse than the Depression [29]
-
Nobel prize winning economist Joseph Stiglitz said "this is worse than the Great Depression" [30]
-
Economics scholar and former Federal Reserve Governor Frederick Mishkin said that conditions were worse than during the Depression [31]
-
Well-known PhD economist PhD Economist Marc Faber believes this could be far worse than the Great Depression[32]
-
Former Goldman Sachs chairman John Whitehead thinks that the current slump is worse than the Depression [33]
-
Morgan Stanley’s UK equity strategist Graham Secker predicts economic collapse worse than the Great Depression [34]
-
Former chief credit officer at Fannie Mae Edward J. Pinto said in January 2009 that the current housing crisis was worse than the Depression, and that current efforts to rescue the mortgage industry are less successful than those used during the 1930s. [35]
-
Billionaire investor George Soros said in February 2009 that the current economic turbulence is actually more severe than during the Great Depression, comparing the current situation to the demise of the Soviet Union. [36]
What Will Economic Conditions Be Like In the Future?
As of this writing, the fact that unemployment will substantially increase is quite controversial. Most people still assume that the benefits of the government's policies will soon kick in, the economy will recover, and then jobs will recover soon afterwards.
In order to accurately determine how bad general economic conditions - and thus unemployment - might be in the future, it is necessary to look at a variety of trends, including residential real estate, commercial real estate, toxic assets held by banks, loan loss rates, consumer spending, age demographics, the decline in manufacturing, and destruction of credit.
Residential Real Estate
Citigroup is projecting that unemployment in Spain will rise from its current 17.9% to 22% next year. [37]
Spain's unemployment is largely driven by the bursting of its housing bubble. [38]
Housing bubbles are now bursting in China [39], France [40], Spain [41], Ireland [42], the United Kingdom [43], Eastern Europe [44], and many other regions. [45]
(And unemployment in Japan is apparently at the highest level since the government began collecting the data in 1953, a year after the U.S. military occupation ended.)[46]
Unfortunately, while the peak in subprime mortgages is behind us, many analysts say that Alt-A mortgage defaults have not yet occurred (as of this writing), but will not peak until 2010.[47]
Indeed, the crash in real estate and rising unemployment together form a negative feedback loop. As McClatchy notes, foreclosures rise as jobs and income drop. [48]
Former chief IMF economist Simon Johnson notes that a vicious cycle also exists between unemployment and property foreclosures:
Unemployment is always a lagging indicator, and given the record low number of average hours worked, it will turn around especially slowly this time. Until then, people will continue to lose their jobs and wages will remain flat, and any small rebound in housing prices is unlikely to help more than a few people refinance their way out of unaffordable mortgages. So unless the other part of the equation – monthly payments – changes, the number of foreclosures should just continue to rise.[49]
Indeed, the Washington Post notes:
The country's growing unemployment is overtaking subprime mortgages as the main driver of foreclosures, according to bankers and economists, threatening to send even higher the number of borrowers who will lose their homes and making the foreclosure crisis far more complicated to unwind. [50]
Commercial Real Estate
Moreover, a crash in commercial real estate is now picking up speed. Unlike the subprime mortgage meltdown - which affected mainly the biggest banks - the commercial meltdown will apparently affect a huge number of small to medium-sized banks. [51]
On August 11, 2009, the Congressional Oversight Panel on the bailouts issued a report saying that small and medium sized banks are especially vulnerable, the report will say, in part they hold greater numbers of commercial real estate loans, "which pose a potential threat of high defaults." [52]
That could spell real trouble for employment by small businesses since (1) smaller institutions are disproportionately responsible for providing credit to small businesses [53], (2) credit is essential for many small businesses, (3) commercial real estate is crashing even faster than residential [54], and (4) industry experts forecast that the commercial real estate market won't bottom out for three more years.[55]
Indeed, largely because of the commercial real estate crash, the FDIC expects 500 banks to fail in the coming months. [56]
Unfortunately, the crash in commercial real estate is occurring world-wide. [57]
Toxic Assets
The Congressional Oversight Panel report also says that banks remain threatened by billions of dollars of bad loans on their balance sheets, more could fail if the economy worsens, and that - if unemployment rises sharply or the commercial real estate market collapses – the banking system could again crash:
The financial system [still remains] vulnerable to the crisis conditions that [the bailout] was meant to fix...
Financial stability remains at risk if the underlying problem of toxic assets remains unresolved.[58]
As Reuters notes:
The chairman of the congressional oversight panel, Elizabeth Warren, said no one even knows the value of the toxic assets still on banks' books...
"No one has a good handle how much is out there," Warren said. "Here we are 10 months into this crisis...and we can't tell you what the dollar value is."[59]
Loan Loss Rates
Loan loss rates in could also be worse than the Great Depression, at least in the United States. Specifically, during the depths of the Great Depression, the loss rate which banks suffered on their loans climbed as high as 3.4% (it is normally well under 2.0%).[60]
Last month, banking analyst Mike Mayo predicted that loan loss rates could go as high as 5.5%, which is substantially higher than during the 1930s.[61]
But the Federal Reserve's more adverse scenario for the stress tests - which everyone knows is too rosy concerning most of its assumptions - predicts a loan loss rate of 9.1%, nearly three times higher than during the 1930s.[62]
As US News and World Report wrote in May 2009:
For most of the past 50 years, the loss rate on all bank loans has stayed well under 2 percent. The Fed estimates that over the next two years the loss rate could reach 9.1 percent. You know all those historical comparisons that end with "the worst since the Great Depression"? Well, 9.1 percent would be EVEN WORSE than during the 1930s. Still looking forward to a soft landing or a quick recovery?[63]
Consumer Spending
Consumer spending accounts for the vast majority of the economy in the United States. The figure commonly cited is that consumer spending accounts for 70% of U.S. Gross Domestic Product. [64]. (Consumer spending has been a lower percentage of GDP in most other countries. [65])
But the economic crisis is driving consumer spending downward. Economist David Rosenberg [66] says that consumers have undergone a generational shift in spending habits, and will be frugal for a long time to come.[67]
The head of Collective Brands, Matthew Rubel, states:
Consumer spending as a percentage of GDP has moved down, will probably continue to move down through the end of year, and then normalize as we get into somewhere in early-to-mid next year, from our point of view.[68]
The chief economist of IHS Global Insight, Nariman Behravesh, says consumer spending will decline to 65 percent of GDP:
With individuals more focused on saving than spending, Behravesh said retail consumer spending as a percentage of GDP is likely to fall from 70 percent to 65 percent. “It will take a while, maybe 10 years,” he said. “Correspondingly other countries are going to have to shift in the opposite direction to rely more on their own consumers rather than the U.S. consumers.”[69]
Jason DeSena Trennert, Chief Investment Strategist for Strategas Research Partners, says:
Consumer spending as a percentage of GDP is going to go in one direction for a long time -- lower.[70]
Time points out :
Economist Stephen Roach, chairman of Morgan Stanley Asia, says that "there is good reason to believe the capitulation of the American consumer has only just begun." U.S. consumer spending as a percentage of GDP reached 72% in 2007, well above the pre-bubble norm of 67%. Using that as a gauge, Roach says that only 20% of the potential retrenchment of spending has taken place, even after the dramatic decline at the end of 2008. "The imbalance that contributed to the crisis — overconsumption and excessive savings — cannot continue," says Ajay Chhibber, director of the Asia bureau at the United Nations Development Program in New York City. "The model where you stimulate and [then] go back to the old days is gone."[71]
The Wall Street Journal notes:
"Economists also see an upturn in U.S. household saving as the beginning of a prolonged period of thrift....."[72]
Demographics
Financial analysts who have studied U.S. demographics - like Harry Dent and Claus Vogt - point out that the U.S. population is aging:
United States Population Pyramid for 2010
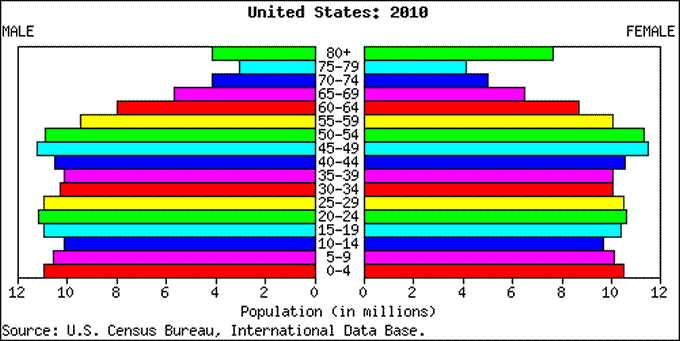
United States Population Pyramid for 2020
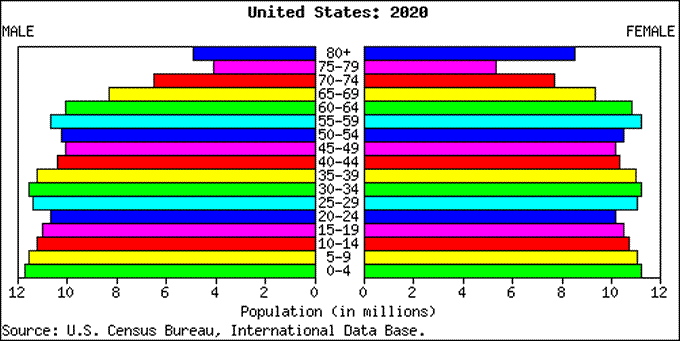
United States Population Pyramid for 2050
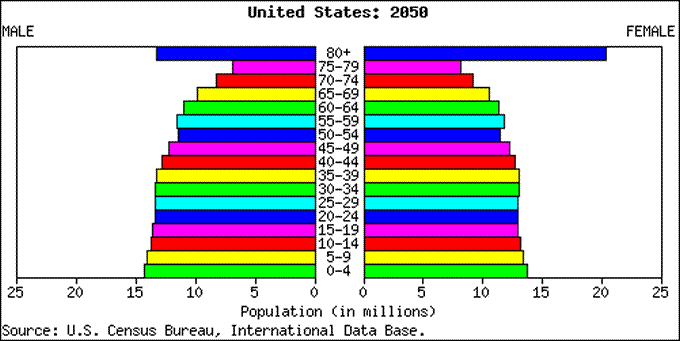
Vogt argues that an aging population within a given nation is correlated with a decline in that country's economy. [74]. Certainly, a population with less working-age people and more dependent elderly people will experience a drag on its economy.
Dent argues that one of the main drivers of a country's economic growth is the number of people in the country who are in their peak spending years.
For example, Dent says that in the U.S., 45-54 year olds are the biggest spenders, because that is when - on average - they are paying for their kids' college, paying mortgage on the biggest house they will own during their life, etc. Dent argues that the American economy will tend to grow when the number of 45-54 year olds grows, and to shrink when it shrinks.
As the charts above show, the number of 45-54 year olds in the U.S. will shrink considerably in the year ahead.
Global Research Articles by Washington's Blog
© Copyright Washingtons Blog, Global Research, 2009
Disclaimer: The views expressed in this article are the sole responsibility of the author and do not necessarily reflect those of the Centre for Research on Globalization. The contents of this article are of sole responsibility of the author(s). The Centre for Research on Globalization will not be responsible or liable for any inaccurate or incorrect statements contained in this article.
© 2005-2022 http://www.MarketOracle.co.uk - The Market Oracle is a FREE Daily Financial Markets Analysis & Forecasting online publication.