U.S. Debt as a Percentage of GDP Means No Growth for 50 Years
Interest-Rates / US Debt Aug 15, 2009 - 12:51 PM GMTBy: Andy_Sutton
 Apparently, a bazooka wasn’t enough. Last summer, that is what then Secy. of the Treasury Henry Paulson asked for when he made his case for sweeping financial powers. Instead, Congress gave him a nuke, and apparently that wasn’t enough either. Making the jump from completely absurd to the absolutely ridiculous, Timothy Geithner became the latest in a long line of Treasury Chiefs to run to Congress to ask for an increase in the nation’s debt ceiling.
The fact that he is asking for the increase should not be a surprise to anyone given the massive deficits already racked up over the past 18 months. What would be laughable if it weren’t so serious, however, were the comments made in his request letter to Congress.
"It is critically important that Congress act before the limit is reached so that citizens and investors here and around the world can remain confident that the United States will always meet its obligations,"
How exactly does digging your hole even deeper inspire confidence? How does borrowing nearly 50 cents of every dollar you spend inspire confidence? How can anyone with two bits of common sense to rub together take this as anything less than an overt devaluation of the Dollar?
Yet his request was taken in a ‘business as usual’ manner by the media. Of course, this could be due to the fact that in our age of borrow and spend, these requests are becoming more and more commonplace. Perhaps this is one of the reasons people are so annoyed these days?
Debt as a percentage of GDP
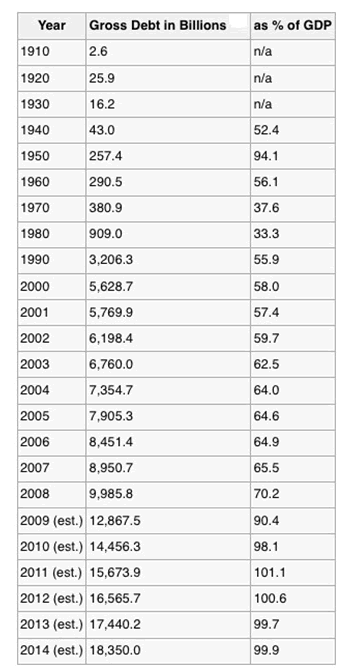
This is one of the ways that the overall debts of one nation can be compared to those of another. In 2009, US public debt will be approximately 90% of GDP. It will quickly approach and surpass 100% of GDP in the near future. The chart below, sourced from FY 1020 historical budget tables on pp. 127-128, outlines in dramatic detail the accumulation of debt.

But the chart, unfortunately, only tells a very small portion of the story. First of all, there are some rather interesting assumptions being made here:
1) The chart deals in gross GDP, which is actually better for the discussion since we don’t have to worry about the deflator (GDP Price Index) clouding the initial discussion.
2) The chart assumes that 2009 GDP will be $14,233.96 billion. Given that 2008 GDP was $14,441.40 billion, this constitutes a total drop in GDP of $207.44 billion or 1.44%. This seems a bit shallow considering that to date gross GDP is already 1.38% below that of Q4 2008. That puts the annual pace of the contraction at 2.76%.
3) 2014 estimates place a national public debt of $18,350 billion at 99.9 percent of GDP. This implies a GDP of $18,368.4 billion. This assumes an immediate return to 5% GDP growth per year for each of the 5 years estimated.
Let’s say for example that the rate of ‘recovery’ is more realistic at 2.5% (a rather charitable assumption given the current state of affairs). Suddenly by 2014, the public debt is a whopping 113% of GDP instead of the 99.9% assumed. If we take it a step further and set the GDP growth to 1%/year, which is probably rather close to a best-case scenario, then the $18,350 billion of public debt in 2014 becomes 127% of GDP.
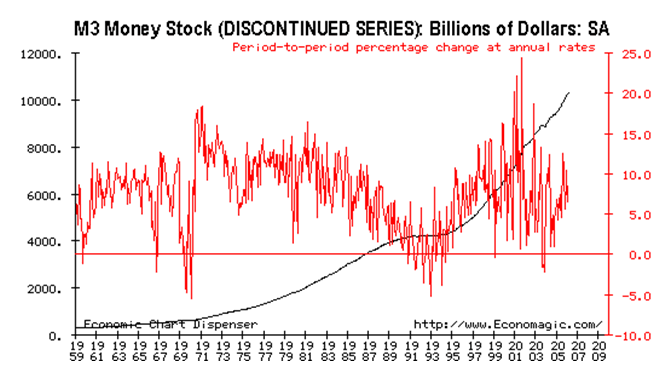
So the big question is where did the assumption of a return to 5% growth come from? Let us take a look at a popular, but discontinued series – M3. Discontinued, if you remember, to save the taxpayers money.

If you do a little smoothing on the data, you will find that M3 generally rose at a rate of very close to 5% per annum. From a monetarist’s perspective, THIS is the real rate of inflation, not what is displayed in the CPI, the GDP price index or other hedonically adjusted numbers.
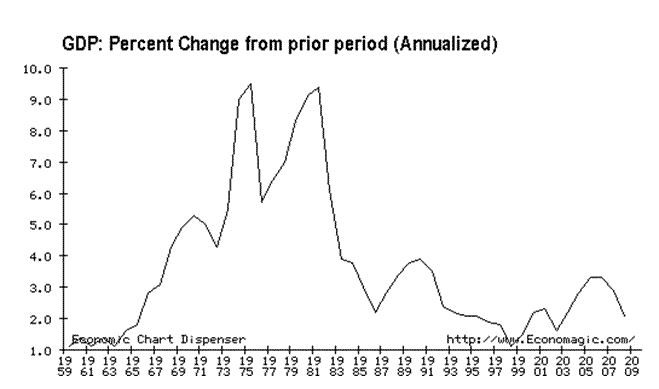
I think that most people are able to understand the implications of discounting annual GDP growth by 5% every single year. Just to make the point, it is included below:

If you perform the same smoothing on this data, amazingly, you’ll come up with almost the same 5% as above.
What this means is that since 1959, we have had almost no growth in real GDP over the period, but have gone into debt nearly eleven and a half trillion dollars to do it.
Now many folks will nitpick about the fact that M3 growth should not be used to adjust GDP, but if you’re going to understand that inflation is an increase in the money supply, then you’d better discount your GDP by the growth in the money supply, not by some politically driven price index, which at best only measures one of the symptoms of actual inflation.
Given the fact that we have such a dismal record of turning our borrowed dollars into anything productive, it would make sense to prohibit the government from borrowing any more money on the behalf of the people. Surely Secy. Geithner is aware of this awful record.
But it gets even better.
"Congress has never failed to raise the debt limit when necessary,"
I would contend that in never failing to increase the debt ceiling that Congress has done exactly that - failed.
By Andy Sutton
http://www.my2centsonline.com
Andy Sutton holds a MBA with Honors in Economics from Moravian College and is a member of Omicron Delta Epsilon International Honor Society in Economics. His firm, Sutton & Associates, LLC currently provides financial planning services to a growing book of clients using a conservative approach aimed at accumulating high quality, income producing assets while providing protection against a falling dollar. For more information visit www.suttonfinance.net
Andy Sutton Archive |
© 2005-2022 http://www.MarketOracle.co.uk - The Market Oracle is a FREE Daily Financial Markets Analysis & Forecasting online publication.


