


US Consumer Credit Shows Steepest Contraction in 5 Decades
Economics / US Debt Aug 11, 2009 - 01:34 AM GMTBy: Mike_Shedlock

 Please consider Monday morning's Breakfast With Dave regarding an unprecedented drop in consumer credit.
No Credit Where Credit Is Due
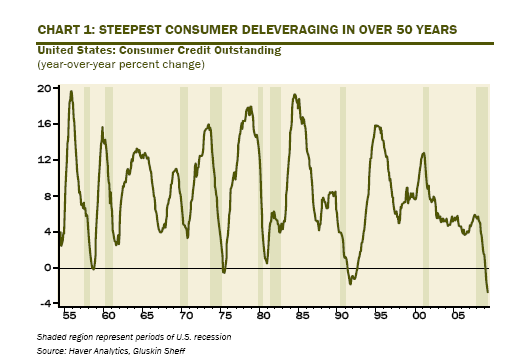
U.S. consumer credit outstanding fell $10 billion in June, the fifth decline in a row during which the debt balance has shrunk $60 billion or 5.5% at an annual rate — both figures are unprecedented. As the chart below shows, the YoY trend, at -2.8%, is also running at its steepest contractionary rate in over five decades.
Welcome to the new paradigm of savings, asset liquidation and debt repayment — the era of consumer frugality. After 20 years of living beyond their means, American consumers will be spending the next several years living below their means, and no, this will not be the end of the world, but it will put a firm ceiling on overall demand growth for some time to come.
Consumer Credit Outstanding
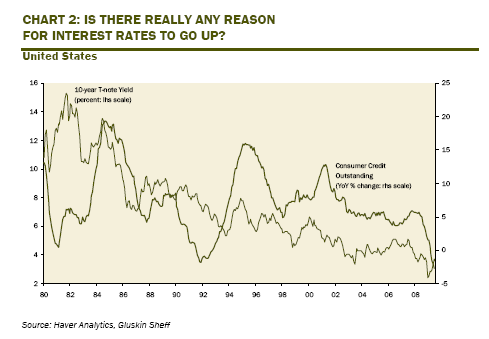
10-Year Treasuries vs. Consumer Credit
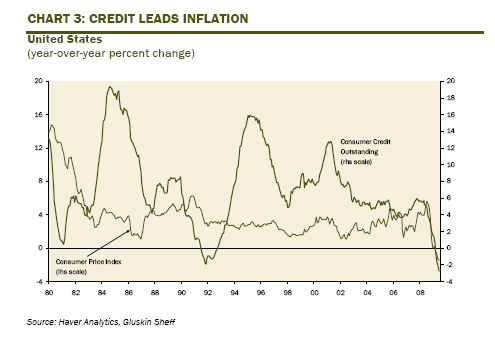
CPI vs. Consumer Inflation
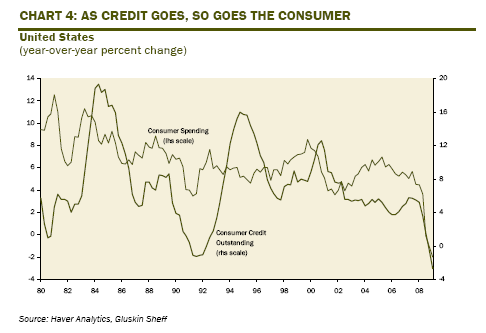
Consumer Spending vs. Consumer Credit
Record Slide In Bank Lending
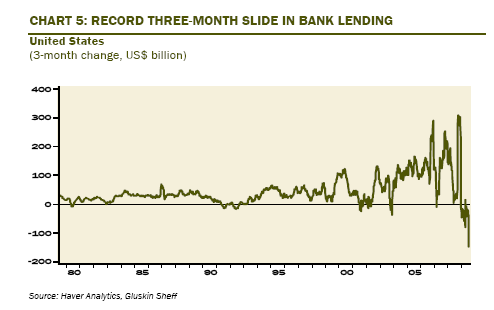
We just received the monthly data on commercial bank lending in July and it showed a record contraction of $64.0 billion, which is the equivalent of a 12.0% annualized decline. This was the third month in a row of declining bank credit to households and businesses during which the contraction has totaled $149.0 billion (again, an unprecedented 9.0% decline at an annual rate). We are not sure if a recovery can be sustained without credit creation — we haven’t seen it happen in the past, but maybe there is a new paradigm of a credit-less recovery awaiting us.
Thanks to Dave Rosenberg for the above series of 5 stunning charts that highlight the inflation/deflation debate. The key take away is those charts all show deflation.
Indeed, in a credit based economy a better title for chart 3 might be "Credit IS Inflation".
With that thought, you may wish to review the Fiat World Mathematical Model that explains why the money multiplier lag theory fails and why it's credit, not base money supply that is important.
By Mike "Mish" Shedlock
http://globaleconomicanalysis.blogspot.com
Click Here To Scroll Thru My Recent Post List
Mike Shedlock / Mish is a registered investment advisor representative for SitkaPacific Capital Management . Sitka Pacific is an asset management firm whose goal is strong performance and low volatility, regardless of market direction.
Visit Sitka Pacific's Account Management Page to learn more about wealth management and capital preservation strategies of Sitka Pacific.
I do weekly podcasts every Thursday on HoweStreet and a brief 7 minute segment on Saturday on CKNW AM 980 in Vancouver.
When not writing about stocks or the economy I spends a great deal of time on photography and in the garden. I have over 80 magazine and book cover credits. Some of my Wisconsin and gardening images can be seen at MichaelShedlock.com .
© 2009 Mike Shedlock, All Rights Reserved
Mike Shedlock Archive |
© 2005-2022 http://www.MarketOracle.co.uk - The Market Oracle is a FREE Daily Financial Markets Analysis & Forecasting online publication.