


Weekly Stock Market Technical Analysis Report - 11th June 07
Stock-Markets / US Stock Markets Jun 11, 2007 - 10:35 AM GMTBy: Mike_Burk

The good news is: All of the major indices hit multi year or all time highs Monday.
Short Term
All of the major indices completed a run of 6 consecutive up days on Monday leaving the market very overbought. The three consecutive down days that followed culminated in a washout on Thursday that is likely to have relieved selling pressure for the next several weeks.
On Thursday the ratio of downside volume to upside volume was 6.7 to 1 on the NASDAQ and 17 to 1 on the NYSE the most extreme that we have seen since February 27.
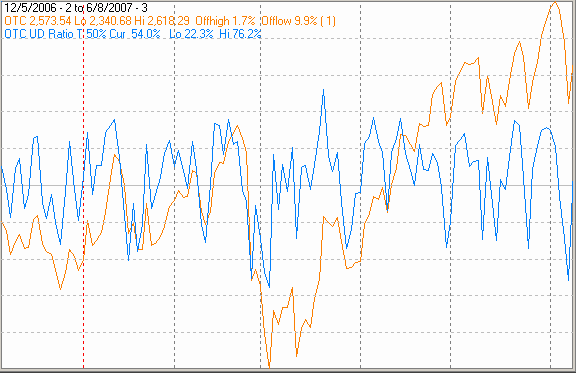
The first two charts cover the past 6 months with dashed vertical lines on the 1st trading day of each month and horizontal lines at 10% intervals for the indicator. The indicator is a 50% trend (3 day EMA) of upside volume / (upside volume + downside volume).
The first chart shows the NASDAQ composite (OTC) in orange and the indicator, calculated from NASADAQ data, in blue.
The next chart shows the S&P 500 (SPX) in blue and the indicator, calculated from NYSE data, in green.
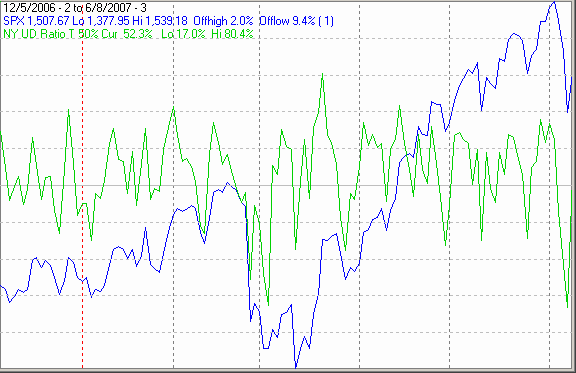
Measured by the ratio of upside to downside volume the sell off last week was as severe as the sell off in late February. Panic sell offs are good. What we do not want to see is an orderly decline.
Intermediate term
There are long standing rules of thumb about new lows that say there is little need for concern until there have been several consecutive days of more than 40 new lows on the NYSE and 70 on the NASDAQ.
The table below shows new lows for each exchange on each day last week.
The NYSE exceeded its threshold on the last three days of last week while the NASDAQ exceeded its threshold on the last two days of last week.
| New lows | NASDAQ | NYSE |
| Monday | 22 | 22 |
| Tuesday | 32 | 36 |
| Wednesday | 47 | 48 |
| Thursday | 63 | 104 |
| Friday | 42 | 91 |
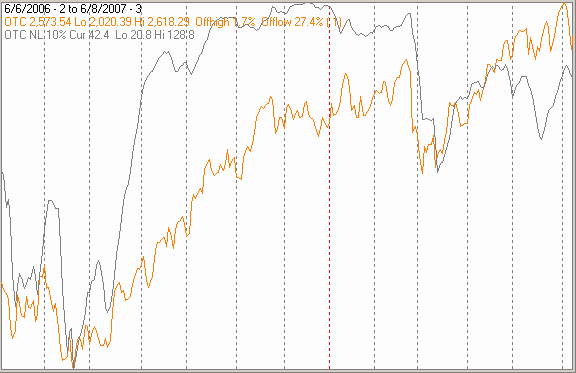
The chart below covers the past year showing the OTC in orange and a 10% trend (19 day EMA) of NASDAQ new lows (OTC NL) in black.
OTC NL has been plotted on an inverted Y axis so increasing new lows move the indicator downward (up is good).
When the OTC made its multi year high on Monday the indicator was lower than it was at the late February high. So far, at least, the indicator has held up pretty well.
The next chart is similar to the one above except the index is the SPX shown in blue and the indicator (NY NL) has been calculated from NYSE data.
This chart is less comforting than the one above. The indicator has been falling over the past month while the index has been rising. Furthermore the value of the indicator is 40, right at the threshold for concern.
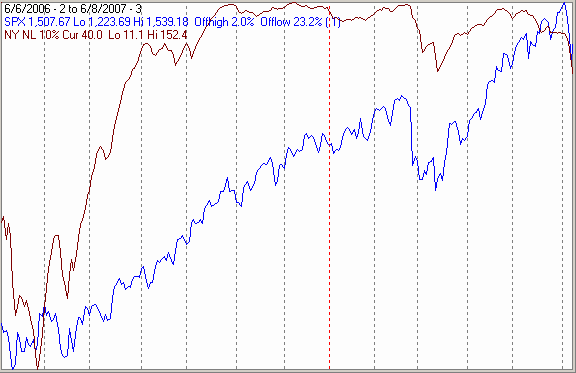
I have often pointed out the secondaries lead both up and down and the NASDAQ has a higher percentage of small cap issues than the NYSE so when there are inconsistencies between NYSE and NASDAQ indicators you would expect the NASDAQ indicators to be more relevant.
I hope so.
Seasonality
Next week is the week prior to the 3rd Friday in June during the 3rd year of the Presidential Cycle.
The tables show the daily returns for the week prior to the 3rd Friday of June which is when options and futures expire. NASDAQ data covers the period from 1963 - 2003 and SPX data from 1955 - 2003. There are summaries for both the 3rd year of the Presidential Cycle and all years combined. The SPX summary for all years combined begins with 1953 because prior to that the market traded 6 days a week.
Both indices have been strong during the 3rd year of the Presidential Cycle. The OTC has been up 82% of the time while the SPX has been up 77% of the time. Both have had average returns well over 1% for week. Over all years both indices have been up about half the time with slightly negative average returns.
Report for the week before the 3rd Friday of June
The number following the year is the position in the presidential cycle.
Daily returns from Monday through 3rd Friday.
| OTC Presidential Year 3 | ||||||
| Year | Mon | Tue | Wed | Thur | Fri | Totals |
| 1963-3 | -0.03% | 0.03% | 0.44% | 0.27% | 0.24% | 0.94% |
| 1967-3 | 0.73% | 0.67% | 0.64% | 0.15% | 0.62% | 2.81% |
| 1971-3 | -0.57% | -0.19% | 0.07% | 0.00% | -1.17% | -1.86% |
| 1975-3 | 0.70% | -0.69% | 0.05% | 1.29% | 0.82% | 2.16% |
| 1979-3 | 0.06% | 0.65% | 0.07% | 0.01% | 0.17% | 0.95% |
| 1983-3 | 0.89% | 0.63% | 0.62% | 1.38% | -0.12% | 3.41% |
| Avg | 0.36% | 0.21% | 0.29% | 0.71% | 0.06% | 1.50% |
| 1987-3 | 0.00% | 0.50% | 0.21% | 0.12% | 0.03% | 0.87% |
| 1991-3 | -0.15% | -0.55% | -1.27% | 0.11% | -0.01% | -1.88% |
| 1995-3 | 0.41% | 0.70% | 0.17% | 0.78% | 0.66% | 2.72% |
| 1999-3 | -2.03% | 0.68% | 4.27% | 1.04% | 0.76% | 4.73% |
| 2003-3 | 2.46% | 0.11% | 0.52% | -1.70% | -0.24% | 1.16% |
| Avg | 0.14% | 0.29% | 0.78% | 0.07% | 0.24% | 1.52% |
| OTC summary for Presidential Year 3 1963 - 2003 | ||||||
| Avg | 0.22% | 0.23% | 0.53% | 0.34% | 0.16% | 1.46% |
| Win% | 64% | 73% | 91% | 90% | 64% | 82% |
| OTC summary for all years 1963 - 2006 | ||||||
| Avg | -0.15% | 0.05% | 0.07% | -0.08% | 0.00% | -0.11% |
| Win% | 43% | 59% | 65% | 44% | 58% | 52% |
| SPX Presidential Year 3 | ||||||
| Year | Mon | Tue | Wed | Thur | Fri | Totals |
| 1955-3 | 0.94% | -0.13% | 0.81% | 0.18% | 0.35% | 2.15% |
| 1959-3 | -0.52% | -0.75% | 0.94% | -0.07% | 0.14% | -0.27% |
| 1963-3 | -0.44% | 0.11% | 0.10% | -0.11% | 0.34% | 0.00% |
| 1967-3 | 0.52% | 0.63% | -0.24% | 0.10% | 0.05% | 1.07% |
| 1971-3 | -0.84% | 0.10% | 0.20% | -0.02% | -1.52% | -2.08% |
| 1975-3 | 1.04% | -0.96% | -0.21% | 1.80% | 0.64% | 2.31% |
| 1979-3 | 0.41% | 0.92% | -0.53% | -0.11% | -0.11% | 0.60% |
| 1983-3 | 1.33% | 0.42% | 0.96% | 1.21% | -0.01% | 3.91% |
| Avg | 0.49% | 0.22% | 0.04% | 0.60% | -0.19% | 1.16% |
| 1987-3 | 0.35% | 0.68% | 0.02% | 0.29% | 0.42% | 1.76% |
| 1991-3 | -0.57% | -0.41% | -0.92% | 0.09% | 0.62% | -1.19% |
| 1995-3 | 0.56% | 0.97% | 0.08% | 0.12% | 0.50% | 2.23% |
| 1999-3 | 0.02% | 0.56% | 2.24% | 0.71% | 0.22% | 3.76% |
| 2003-3 | 2.24% | 0.09% | -0.16% | -1.52% | 0.00% | 0.65% |
| Avg | 0.52% | 0.38% | 0.25% | -0.06% | 0.44% | 1.44% |
| SPX summary for Presidential Year 3 1955 - 2003 | ||||||
| Avg | 0.39% | 0.17% | 0.25% | 0.20% | 0.14% | 1.15% |
| Win% | 69% | 69% | 62% | 62% | 75% | 77% |
| SPX summary for all years 1953 - 2006 | ||||||
| Avg | -0.02% | 0.12% | 0.05% | -0.20% | -0.02% | -0.07% |
| Win% | 57% | 56% | 51% | 41% | 56% | 52% |
Mutual Fund
Compliance issues demand that I not mention the mutual fund that I manage by name or symbol in this letter.
To see a current chart of the fund go to: http://finance.yahoo.com/q/bc?s=APHAX&t=6m&l=on&z=m&q=l&c=
For information about the fund go to: http://www.thealphafunds.com/index.htm
The fund now has service class shares available.
Conclusion
Last weeks sell off probably took out most traders that were interested in selling and we are going into a week that has been seasonally very strong.
I expect the major indices to be higher on Friday June 15 than they were on Friday June 8.
Gordon Harms produces a power point for our local timing group meetings. You can get a copy of that at: http://www.stockmarket-ta.com/ .
Last weeks positive forecast was a miss.
By Mike Burk
To subscribe to this report : http://alphaim.net/signup.html
Mike Burk is an employee and principal of Alpha Investment Management (Alpha) a registered investment advisor. Charts and figures presented herein are believed to be reliable but we cannot attest to their accuracy. Recent (last 10-15 yrs.) data has been supplied by CSI (csidata.com), FastTrack (fasttrack.net), Quotes Plus (qp2.com) and the Wall Street Journal (wsj.com). Historical data is from Barron's and ISI price books. The views expressed are provided for information purposes only and should not be construed in any way as investment advice. Furthermore, the opinions expressed may change without notice.
© 2005-2022 http://www.MarketOracle.co.uk - The Market Oracle is a FREE Daily Financial Markets Analysis & Forecasting online publication.