


Japanese Yen: Resumption of the Bull Market ?
Currencies / Japanese Yen Jul 03, 2009 - 08:15 AM GMTBy: Frederic_Simons

 Until the middle of 2007, the Japanese Yen was notoriously weak, as the selling of this low yielding currency was funding the purchase of higher yielding currencies, ranging from the British Pound to the Australian and New Zealand Dollar and many emerging market currencies. The so-called carry trade yielded investors the interest rate difference between what they paid for borrowing Yen, and what they earned for the investment in high-yield currencies, ie between 3 and 10 percent annually. And since the carry trade was mostly done at a high leverage, the carry trade became a fantastic cash-cow during the days of easy money and complacency.
As the subprime crisis emerged in June 2007, the deleveraging in the financial industry led to the sudden unwinding of the carry trade, and a subsequent rise of the Yen, with spectacular gains against the high-yielding currencies.
For several months then, there was a stunningly high inverse correlation between the price movements in equity markets and those of the Japanese yen. A rising Yen was accompanied by falling stock prices and vice versa. Hence from 2007 through 2008, the Japanese Yen has become famous for being one of the big risk-aversion trades, as investors bought the Yen whenever new fears of failing banks or the breakdown of the financial system as a whole emerged.
Even though you can nowadays (2009) still read on Bloomberg about "Investors buying the Japanese Yen on fear of a lasting downturn in the economy" (or some other fear), the correlation between price movements in the Japanese Yen and in the stock market does no longer exist in the obvious way we could observe in 2007/2008. It rather seems that the Japanese Yen is starting again to trade on its own merits. A reason for this might be the narrowing of interest rates differential between the US and Japan and a lesser risk appetite for currency carry trades in general.
Essentially, as a trader, we do not have to know about the "why" of price behaviour. It seems much more crucial to make the right decisions by observing the price behaviour, determining the line of least resistance, and acting (trading) accordingly.
As you might have seen from previous market comments by Crossroads FX (click here for past newsletters), we prefer an approach that bases short- and intermediate term trade decisions on the actual behaviour of the price, not on fundamental aspects. For this purpose, we developed a proprietary indicator that finds out the line of least resistance both to the downside and to the upside, and prints them on the chart as a green line (buy line) and a red line (sell line). You can see on the following charts that if the price trades for 2 consecutive bars above the green line, rising prices are to be expected. Once the price trades for 2 bars below the red line, you should prepare for falling prices.
Japanese Yen Future 300min Chart:
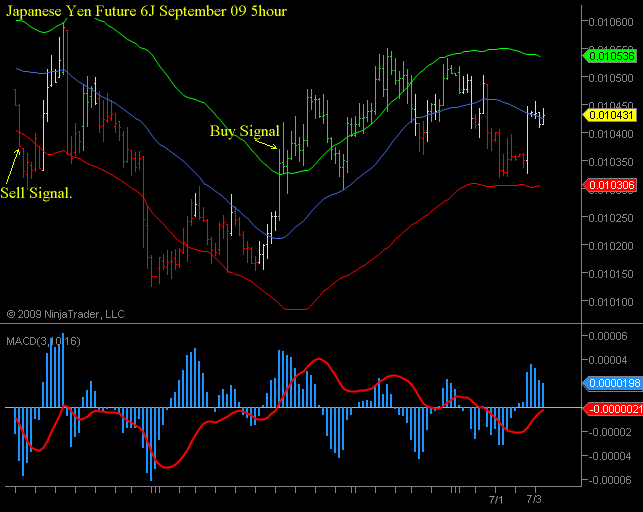
So on the bigger timeframe (300min chart), the Japanese is currently on a buy signal, trading currently at 0.010428, which is equivalent to about 95.90 in USD/JPY.
The smaller timeframe has also just turned bullish, as prices generated a buy-signal yesterday.
Japanese Yen 4300 Tick chart:
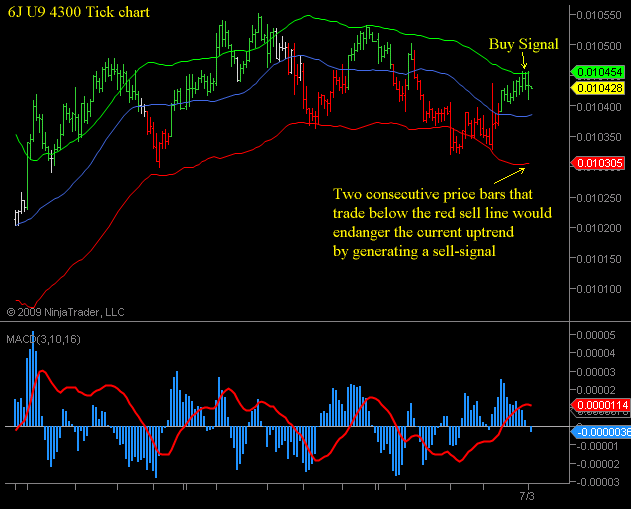
As you can see on the charts above, the red sell-line is at 0.010305 and 0.010306 respectively. This underlines the importance of this price-level, and a sell-signal for the Japanese-Yen would be signalled if prices trade below that level for 2 consecutive bars. Therefore, being a line of least resistance to the downside, this level serves both as a Stop-Loss price level for existing long positions, as well as an entry level for new short positions. This level equals about 97.10 in the USD/JPY.
Hence, the line of least resistance points to higher prices in the Japanese Yen (lower Prices in USD/JPY), unless the Japanese Yen September Future (6J U9) trades below 0.010305. If you are trading USD/JPY in the Spot Market, this means that USD/JPY is pointing lower, unless prices climb above 97.10.
If you have any questions, please do not hesitate to contact us by writing an email to

By Frederic Simons
http://www.crossroadsfx.hostoi.com
© 2009 Copyright Frederic Simons - All Rights Reserved
Disclaimer: The above is a matter of opinion provided for general information purposes only and is not intended as investment advice. Information and analysis above are derived from sources and utilising methods believed to be reliable, but we cannot accept responsibility for any losses you may incur as a result of this analysis. Individuals should consult with their personal financial advisors.
© 2005-2022 http://www.MarketOracle.co.uk - The Market Oracle is a FREE Daily Financial Markets Analysis & Forecasting online publication.