Trading the Short-term Stock Market Trend Within the Long Term Trend
Stock-Markets / US Stock Markets Jun 02, 2007 - 07:19 PM GMT
 We track both the primary (long-term) trend, and the short-term trend. Knowing both is key to making money trading or investing in the stock market . Simply, increase exposure when playing a short-term trend that is in the same direction as the primary trend.
Surprises are likely to go in your favor. An investor or trader can also play a short-term trend that is in the opposite direction as the long term trend, however exposure (the amount invested) should be limited, as surprises are likely to go against the short-term trend. All portfolio managers can benefit their clients considerably, achieving superior returns, by following our Primary Trend Indicators as follows:

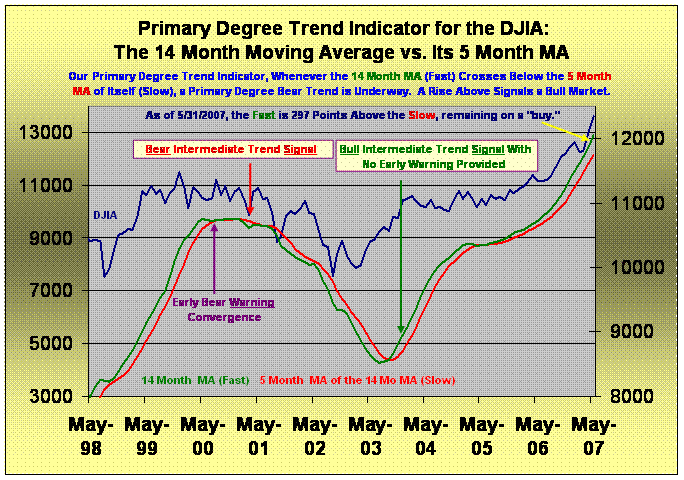
The above chart updates our Primary Trend Indicator for the month of May, 2007 . It remains on a “buy” signal from October 31st, 2003, when the DJIA closed at 9,801.12. One of the tools we have in our arsenal to identify the status of a Primary Degree trend is a simple analysis of the 14 month moving average versus a Slower moving average calculation, the 5 month MA of the 14 month. It has been terrific at identifying multi-year trends, both up and down. While it is a little late in generating the buy and sell signals, it triggered a “sell” near the start of Primary degree wave (4) down, in mid 2000. What followed was a two and a half year, 39 percent drop into the wave (4) bottom on October 10th, 2002 . It took a while for this indicator to confirm that the rally that started on October 11th, 2002 would in fact be a multi-year primary degree wave up, wave (5) up. But by October 2003, this analytical tool did in fact trigger a Primary Degree “buy” signal. Since then, there has been a three and a half year further rally to new all-time nominal highs. We got a near ”sell” signal in mid-2005, but the rally rejuvenated itself, continuing on its ”buy.” As of May 31st, 2007, it remains on its “buy,” and the spread between the Fast and the Slow is widening. The positive spread widened for the first time in several months, from 232 points in March 2007 to 252 in April, widening further to 297 in May. But the spread is relatively narrow, as this compares to a 1,744 positive spread in December 2003. We require a 5 month moving average of the Spread between the Fast and Slow to reverse in a new direction for 3 consecutive months in order to declare that a new primary trend, a new multi-year trend, is underway. Since the PTI generated a “buy” on October 31, 2003, the DJIA has risen 3,872 points, or 39.5 percent .
There have only been two signals since 1997 , so this tool is useful for long-term investors , as it filters out the noise of up and down corrections of significance in favor of the primary trend. It did give an early warning in 1999 and early 2000 as the two measures were nearly identical for several months. This chart is useful for Conservative Balanced Investment Portfolios since once we get a new signal, we can rely upon that signal for years . Further, it tells us which direction surprises are likely to occur , so when playing speculative options or futures, we can know the direction where a surprise trend turn is most likely to occur. Knowledge of the primary trend is also useful for determining how much to invest when trading . We can be more aggressive when entering a position in the same direction as the primary trend, and less aggressive when entering a short-term trend play against the primary trend.
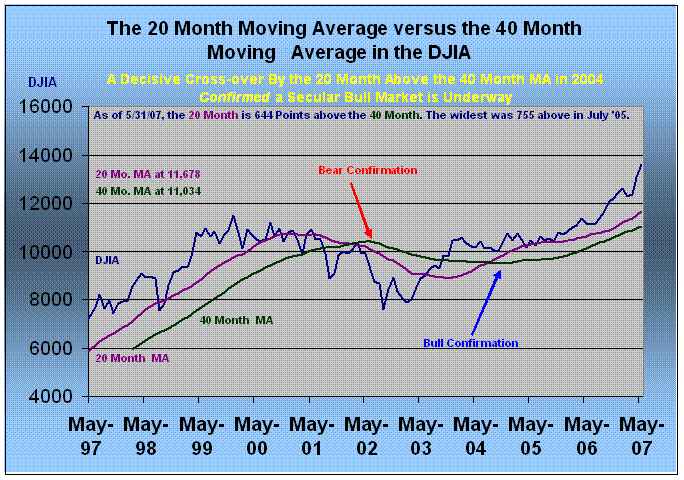
We look at the next chart as a confirming indicator of the Primary Trend Indicator . It is a comparison of the position of the 20 Month Moving average versus the 40 month. As of May 31st, 2007, the 20 Month widened to 644 points above the 40 month, reconfirming the “Primary Trend Bull Market. ” Still, the spread is narrower from its widest point of 755 points in July 2005. What is nice about this indicator, is that once we get this indicator's confirming “buy” or “sell,” we can look forward with high confidence to a large chunk of the primary trend's move still being ahead of us .
For example, the 20 month MA crossed below the 40 month MA in February 2002, with the Dow Industrials at 10,106. From that “sell” signal point, the DJIA dropped 2,909 points, or 28.8 percent. That suggested a great spot to purchase Leaps Put options.
Then, going the other way, the 20 month MA rose above the 40 month MA in August 2004, at DJIA 10,174. The Dow Industrials since rose 3,453 points, or 34.0 percent. Here, your strategy could have been to either play long-term leaps call options, or to simply go long in the cash market and stay there, in other words, increase your long investment position.
There were no false crossovers or cross-unders with this confirming 20 Month/40 Month MA measure. Once it turned negative, the trend was down. Once it went positive, the trend was up.


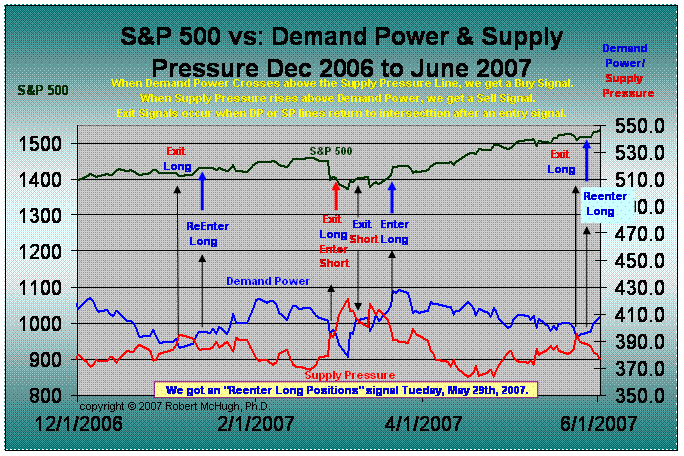
As for determining the short-term trend to trade inside the long term trend, which is helpful for market timers, trend traders, or simply knowing how much to invest and when, we favor the Demand Power/Supply Pressure momentum indicator . The beauty of this indicator is it not only gives us entry signals, but also an exit signal strategy for aggressive traders/investors. Simply, whenever the Demand Power measure crosses decisively above the Supply Pressure line (we consider decisive to be 10 points), we receive an “enter long positions” signal. When the two lines converge and intersect, we get an “exit long positions” signal. Conservative traders always have the option of exiting earlier, once profit targets are met, or before two lines converge. Once Supply Pressure rises 10 points above the Demand Power line, we get an “enter short positions” signal, for
those interested in playing the short side. However, within a primary Bull market, playing the short side short term trend does carry more risk than playing the long side. If playing the short side, you would then exit once the two lines intersect if aggressive, or sooner if conservative.
As of Friday, June 1st, 2007, our proprietary S&P 500 Demand Power/Supply Pressure indicator remains on an “enter long positions” signal from May 29th, 2007, as the Demand Power line shows strong upside momentum, rising more than 10 points above the Supply Pressure line. Once these two lines intersect, we will be given an “exit long positions” signal for the most aggressive traders. To repeat, more conservative traders can exit any time they want, such as once a profit target has been hit, or the two lines converge, but before they actually intersect. The chart appears at the top of the next page. In just three days, since this DP/SP indicator signaled to “enter a long position,” the Dow Industrials rose 170.66 points. We present the DP/SP indicators daily for both the DJIA/S&P 500 and the NASDAQ 100, and the Primary Trend indicators monthly for our regular subscribers.
“And when the disciples saw Him walking on the sea, they were
frightened, saying, “It is a ghost!” And they cried our for fear.
But immediately Jesus spoke to them, saying,
“Take courage, it is I; do not be afraid.”
And Peter answered Him and said, Lord if it is You,
command me to come to You on the water.”
And He said, “Come!” And Peter got out of the boat, and walked on
the water and came toward Jesus.
But seeing the wind, he became afraid,
and beginning to sink, he cried out, saying, “Lord save me!”
And immediately Jesus stretched out His hand and took hold of him,
and said to him, “O you of little faith, why did you doubt?”
Matthew 14: 26-31
For a Free 30 day Trial Subscription , go to
www.technicalindicatorindex.com and click on the button
at the upper right of the Home Page.
by Robert McHugh, Ph.D.
technicalindicatorindex.com
If you would like a Free 30 day Trial Subscription , simply go to www.technicalindicatorindex.com , and click on the FREE Trial button at the upper right of the home page. A subscription gains you access to our buy/sell signals, our Market Analysis Newsletters, Traders Corner, our model Conservative Investment Portfolio, Guest Articles, and our Archives.
Robert McHugh Ph.D. is President and CEO of Main Line Investors, Inc., a registered investment advisor in the Commonwealth of Pennsylvania, and can be reached at www.technicalindicatorindex.com. The statements, opinions, buy and sell signals, and analyses presented in this newsletter are provided as a general information and education service only. Opinions, estimates, buy and sell signals, and probabilities expressed herein constitute the judgment of the author as of the date indicated and are subject to change without notice. Nothing contained in this newsletter is intended to be, nor shall it be construed as, investment advice, nor is it to be relied upon in making any investment or other decision. Prior to making any investment decision, you are advised to consult with your broker, investment advisor or other appropriate tax or financial professional to determine the suitability of any investment. Neither Main Line Investors, Inc. nor Robert D. McHugh, Jr., Ph.D. Editor shall be responsible or have any liability for investment decisions based upon, or the results obtained from, the information provided. Copyright 2007, Main Line Investors, Inc. All Rights Reserved.
© 2005-2022 http://www.MarketOracle.co.uk - The Market Oracle is a FREE Daily Financial Markets Analysis & Forecasting online publication.


