What Happened to the Stock Market New Goldilocks Era?
Stock-Markets / US Stock Markets Jun 30, 2009 - 05:07 AM GMTBy: Sy_Harding
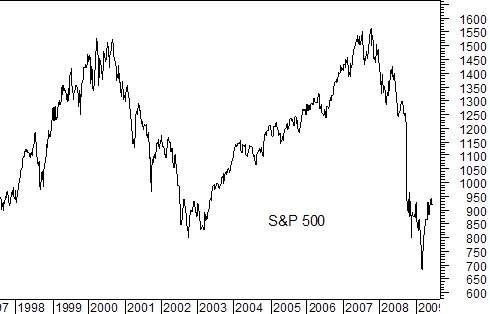
 In 1999, when I wrote Riding the Bear – How to Prosper in the Coming Bear Market, I said the market was in a bubble, and that when it burst the subsequent bear market would be one of the worst since that of 1929-32.
I was ridiculed, and referred to as a dinosaur. The popular book of the time was Dow 40,000. Didn’t I realize it was a new era? The longest running bull market in history, that of the 1990’s, which lasted ten years, had a new generation of investors convinced that was so. We were in a new era in which bear markets were events of ‘the old days’, of the times before the Fed learned to control the economy.
But after the severe 2000-2002 bear market was followed by a typical bull market that lasted a more normal five years, and was then followed by another severe bear market, talk of a new era have disappeared.

Now not only is the R word in everyone’s vocabulary, talk of Great Depression II is commonly bandied about, and the Fed is taking much of the blame for the problems.
The cycle between boom times and recessions, and the cycles between euphoria and fear that accompany them have obviously not gone away. Nor have the cycles between bull markets and bear markets gone away.
So if history is a guide after all, when do most bear markets end?
In the 2nd year of new Presidential Administrations.
From the low in the 2nd year of every Presidential Administration since at least 1918, a rally has taken place to the high the following year. In that rally even the conservative Dow has gained an average of 50%.
Efforts to get toxic waste off the books of banks are stumbling.
The Wall Street Journal reports this morning that the Treasury’s plan (the Public-Private Investment Program) introduced in March, to encourage businesses and investors to buy the troubled assets on the books of banks at bargain prices, faces problems. Large banks are balking, concerned about selling the assets (bad loans and mortgages) at what might turn out to be fire-sale prices if everything recovers, while investors are reluctant to buy if it means getting involved with a government program, where they may be criticized or even punished if they wind up making a big profit.
Last Night:
Asian markets were mostly down last night, the DJ Asia-Pacific Index closing down 0.9%.
Among individual markets, Australia closed down 0.4%. Hong Kong closed down 0.4%. Taiwan closed down 1.1%. Singapore closed down 0.1%. India closed up 0.1%. Malaysia closed unchanged. South Korea closed down 0.4%. Japan closed down 1.0%. China closed up 1.6%.
(Scroll down to Saturday for an interesting look at how individual global markets have fared over the last three weeks).
This morning:
European markets are up, from 1% to 2%, following their quite negative week last week.
Oil is up $0.70 a barrel at $69.91.
Gold is down $1.50 an ounce, $937.60.
In the U.S.:
This week will be a four-day week in the U.S., with markets closed for Independence Day on Friday. The week has a quite heavy schedule of important potential market-moving economic reports coming out, including the first look at the employment picture in June, with the ADP Employment Report for June on Wednesday, and the Labor Department’s Monthly Jobs Report on Thursday. On the housing industry there will be Construction Spending and Pending Home Sales. To see the full schedule click here, and look in the left side of the page it takes you to.
Our pre-open indicators this morning are fractionally positive, pointing to the Dow being up 10 points or so in the early going, meaningless as to it direction or close.
But the next weekly pattern is for the ‘monthly strength period to start about now and to run through next Monday.
Interesting Charts of the Morning:
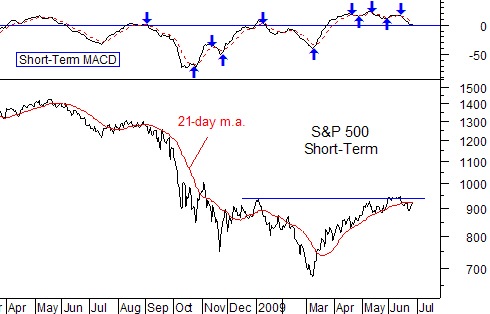
Global markets (minus the U.S. market) in general appear to be in the beginning stages of a correction, showing little inclination to fight it since topping out in early May.

But the U.S. market’s pullback in early May was only temporary.
It is one world economically, and global markets do tend to move in tandem with the U.S., as shown in the charts prior to now.
So the current divergence is curious, particularly since the economic, housing, and financial industry problems, are supposedly not as severe globally as in the U.S.

Please scroll down to see other recent ‘Interesting Charts of the Morning’.
To read my weekend newspaper column ‘A CASE FOR U.S. TREASURY BONDS’ Click here.
Subscribers: The new issue of the newsletter will be on your website later today.
Non-subscribers: While it’s helpful to look at daily and short-term expectations, it is the intermediate and longer-term market moves that are most important to investors.
Street Smart Report Online provides our intermediate-term signals, outlook, and recommended holdings. Sectors, stocks, bonds, gold, short-sales, long-side and inverse etf’s and mutual funds. Highly regarded and in its 22nd year. In-depth weekly reports, newsletter, hotline, and much more! As a bonus for a one-year subscription you will also receive my new book Beat the Market the Easy Way- Proven Seasonal Strategies That Double the Market’s Performance. Click here for subscription information. The cost is equivalent to the cost of two cups of coffee per week. Can you afford not to subscribe?
Sy Harding publishes the financial website www.StreetSmartReport.com and a free daily market blog at www.SyHardingblog.com.
Disclaimer: The above is a matter of opinion provided for general information purposes only and is not intended as investment advice. Information and analysis above are derived from sources and utilising methods believed to be reliable, but we cannot accept responsibility for any losses you may incur as a result of this analysis. Individuals should consult with their personal financial advisors.
© 2005-2022 http://www.MarketOracle.co.uk - The Market Oracle is a FREE Daily Financial Markets Analysis & Forecasting online publication.


