


MSCI Japan Index Fund EWJ and the US Dollar Japanese Yen Relationship
Stock-Markets / Japanese Stock Market Jun 05, 2009 - 06:07 PM GMTBy: Guy_Lerner

 I would like to explore the relationship between the i-Shares MSCI Japan Index Fund (symbol: EWJ) and the US Dollar Japanese Yen (symbol: USDJPY) cross match. What piques my interest is that the Dollar is up almost 2% today against the Yen. Furthermore, the "next big thing" indicator suggests that both assets have a high likelihood of undergoing secular trend reversal.
Figure 1 is a monthly chart of the EWJ with the "next big thing" indicator in the lower panel. I have also placed pivot points on the price chart and a close above one of these pivot points provides a good entry point when the "next big thing" indicator is in the zone. Now look to the current time frame. Due to the "v" shaped bounce there is no pivot point to "tag" an entry. Nonetheless, price has yet to penetrate the very steep down trend line.
Figure 1. EWJ/ monthly
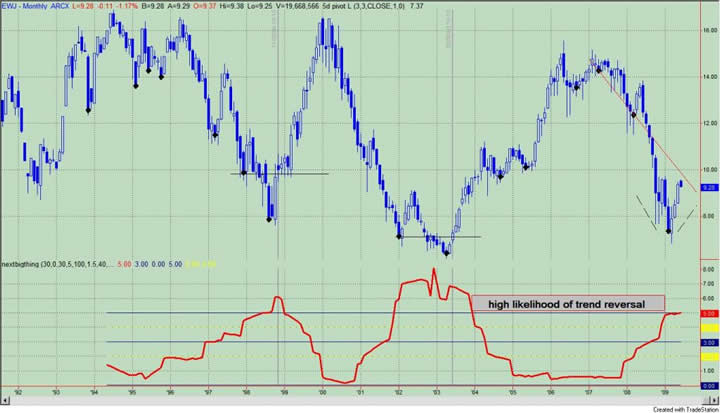
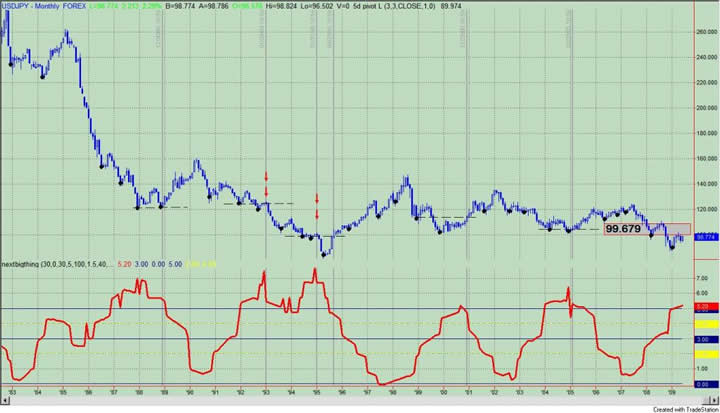
Figure 2 is a monthly chart of the USDJPY cross match with the "next big thing" indicator in the lower panel. Once again, I have placed pivot points on the chart, and a close above of these pivot points provides a good entry point. Several failed signals are noted with the down red arrows, and in the current time frame, USDJPY has yet to close above the most immediate pivot (or resistance level) at 99.679.
Figure 2. USDPY/ monthly
What should be clear is my pursuit to try to define those technical dynamics that lead to secular trend changes. Just a casual look at the charts show that when the "next big thing" indicator is in the buy zone, there is a high likelihood of a secular trend change leading to a multi year upward price move. We want tailwinds - not headwinds!
Now let's contrast EWJ to USDJPY. See figure 3 a monthly chart; USDJPY is in the top panel and EWJ is in the bottom panel. From 1992 to 2005, the relationship is pretty clear. As the USDJPY fell (i.e., Yen strengthened), the EWJ rose. When the USDJPY rose, the EWJ fell.
Figure 3. USDJPY v. EWJ/ monthly
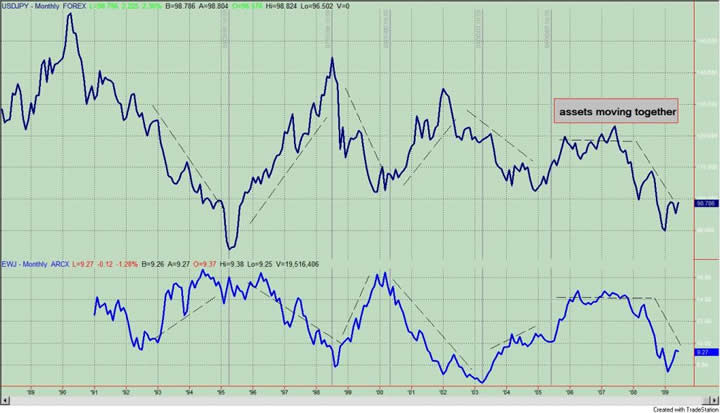
Starting in mid-2005, both assets have moved in lock step. The USDJPY and EWJ moved together into the highs of mid-2007, and both assets fell together in the deleveraging of 2007 and 2008. During this time period the JPY strengthened and the EWJ fell as well, and I believe this would fit with the new dynamic seen in the US and throughout the developing world in the non-commodity currency countries. Currency devaluation leads to higher asset prices.
USDJPYand EWJ are worth watching because they are both in a position to undergo a secular trend change. Whether the pattern fits the new dynamic or the old one is yet to be determined.
By Guy Lerner
http://thetechnicaltakedotcom.blogspot.com/
Guy M. Lerner, MD is the founder of ARL Advisers, LLC and managing partner of ARL Investment Partners, L.P. Dr. Lerner utilizes a research driven approach to determine those factors which lead to sustainable moves in the markets. He has developed many proprietary tools and trading models in his quest to outperform. Over the past four years, Lerner has shared his innovative approach with the readers of RealMoney.com and TheStreet.com as a featured columnist. He has been a regular guest on the Money Man Radio Show, DEX-TV, routinely published in the some of the most widely-read financial publications and has been a marquee speaker at financial seminars around the world.
© 2009 Copyright Guy Lerner - All Rights Reserved
Disclaimer: The above is a matter of opinion provided for general information purposes only and is not intended as investment advice. Information and analysis above are derived from sources and utilising methods believed to be reliable, but we cannot accept responsibility for any losses you may incur as a result of this analysis. Individuals should consult with their personal financial advisors.
Guy Lerner Archive |
© 2005-2022 http://www.MarketOracle.co.uk - The Market Oracle is a FREE Daily Financial Markets Analysis & Forecasting online publication.