CHINA CRASH - Domino Effect on Stock Markets, and Collateral Effect on Resource Stocks...
Stock-Markets / Global Stock Markets May 28, 2007 - 12:53 AM GMTBy: Clive_Maund
One of the great fears plaguing resource stock investors is what will happen if the broad market suddenly goes into the tank. This fear is quite justified as resource stocks, in particular gold and silver stocks, have generally performed poorly in comparison with the general stock market over the past year, and every time the broad market shows signs of weakness, they have dropped sharply, a good example being last Thursday.
In this article we are going to take a look at the great Chinese equity bubble, and how the bursting of this bubble will probably affect US stock markets and thus resource stocks.
A few days ago Alan Greenspan had a go at bursting the Chinese equity bubble by describing it as just that, but it had little effect as the forces of greed remain in control, although as we shall see, greed could turn to fear at the flick of a switch in this market. We should keep in mind, however, that calling a top even towards the end of a massive bull run is notoriously difficult, but that doesn't mean that when ridiculously overbought conditions prevail, as now, we shouldn't attempt it, because of the serious collateral damage that will ensue in other markets and sectors once the bubble bursts. Note that the bursting of the bubble does not in itself imply that there is anything "wrong" with the Chinese economy per se, rather it is the inevitable consequence of wild speculative excess.
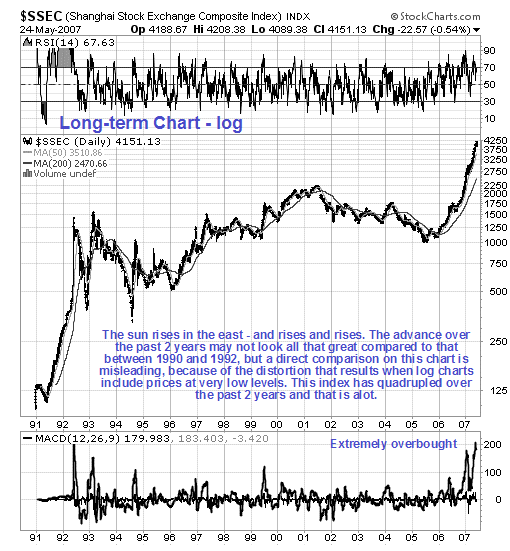
We will start by looking at a long-term chart for the Shanghai SE Composite Index going back to 1990. On this chart we can see the colossal percentage gains made between 1990 and 1992, and it is interesting to observe that, although it meandered about widely in the intervening years, this index made no net progress between the 1993 peak and about April of last year. In 2005 the current powerful bull market started and in the space of just 2 years the index has quadrupled. This rise does not look so impressive - or scary - on this chart, due to the obvious temptation to compare it, at least visually, with the big rise from 1990 - 1992, but remember, this is a log chart, and log charts at low levels create massive distortion. For this reason it is considered prudent to also look at the bull market advance on an arithmetically scaled chart.
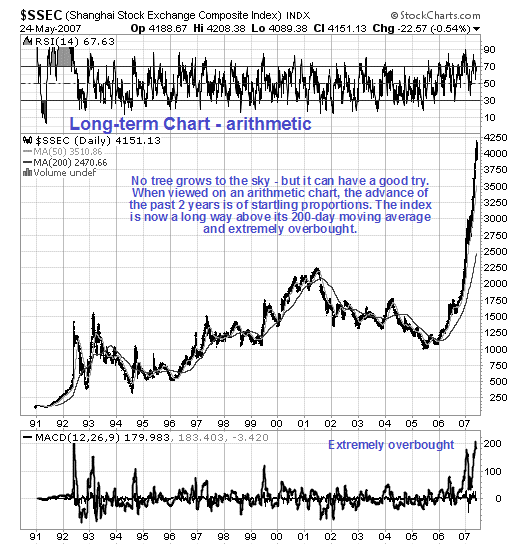
The arithmetic chart for the Shanghai SE Comp Index should be enough to make anyone with even a glimmer of common sense who is involved in this market nervous. By all normal measures this market is insanely overbought, not that this, by itself, will necessarily stop it going even higher. This is because market participants are applying the venerable “Greater Fool Theory” and they are thinking “I may be an idiot buying at these prices, but if this uptrend only continues for a while longer, I will be able to sell for a fat profit to an even bigger idiot in a few weeks or months”. This strange logic is what explains the continuing vertical ascent, but you for sure don't want to be around when the music stops - and blind panic sets in as market participants, many of whom have never experienced such a thing, make the horrifying discovery that markets drop twice as fast as they go up. Many players will be devastated by the collapse and economically wiped out. With stories coming out of China of the butcher, the baker and the candlestick maker getting involved in the market and whole families turning up at the brokerage office to open accounts, an implosion is thought to be fast approaching.
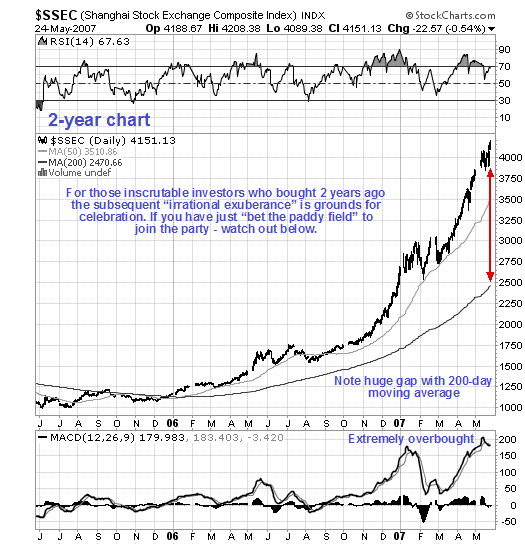
On the 2-year chart we can examine the spectacular ramp of the past 2 years in more detail. A yawning gap of humongous proportions has opened up between the index and its 200-day moving average, and the MACD indicator at the bottom of the chart is still showing a severely overbought condition. Greenspan's warning may have caused a palpitation but has clearly had negligible impact - but that doesn't mean he isn't right. Note that Mr Greenspan said that he feared a “dramatic contraction” in Chinese stocks. He did not use the term “irrational exuberance”. This could be because he discovered after using this term late in 1996 that markets can go on to get a lot more irrational or exuberant - or both.
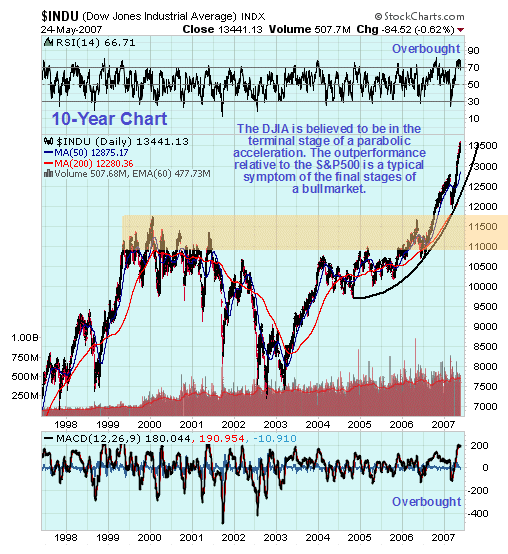
Alright, so what effect would a collapse in the Chinese market have on US stocks? We will now examine the US stockmarket charts to see. When Greenspan made his remarks about China, he would have done well to remember the old saying “People who live in glasshouses shouldn't throw stones” for as we look at the 10-year chart for the Dow Jones Industrials we can immediately see that it is in the throes of a final, vertical blowoff top. There has been a parabolic acceleration in the rate of advance since the late 2004 low, that has culminated with an extremely steep rate of ascent, which has resulted in the 200-day moving average, now quite a long way beneath, rising at a rate that is unsustainable for a long period of time. It is thus viewed as no coincidence that on the chart for the real US stockmarket, the much more widely representative S&P500 index, it appears to be set to Double Top with its highs of 2000.
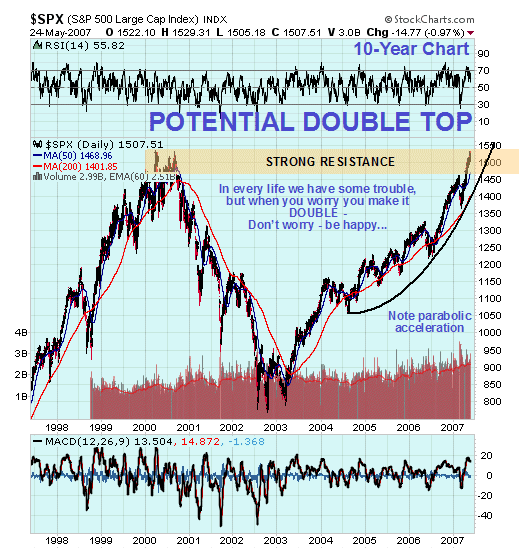
We can see the same pattern of parabolic acceleration on the 10-year chart for the S&P500 index, although the acceleration is not so dramatic as on the DJIA chart. Furthermore, while the DJIA has broken out to clear new highs, the S&P500 has yet to break above its highs of 2000, and is in danger of forming a Double top with those highs. Given that it is a basic tenet of Dow Theory that the big stocks perform best in the final stages of an advance, the massive disparity between these 2 indices at this point is regarded as a warning in the clearest possible terms that a top is close at hand - and an implosion in the Chinese market is, as we have seen, likely to be the catalyst for it.
What can we expect for poor struggling gold and silver stocks in the event of a cascading collapse in world markets precipitated by a meltdown in the Chinese market? Unfortunately, the omens are not good.
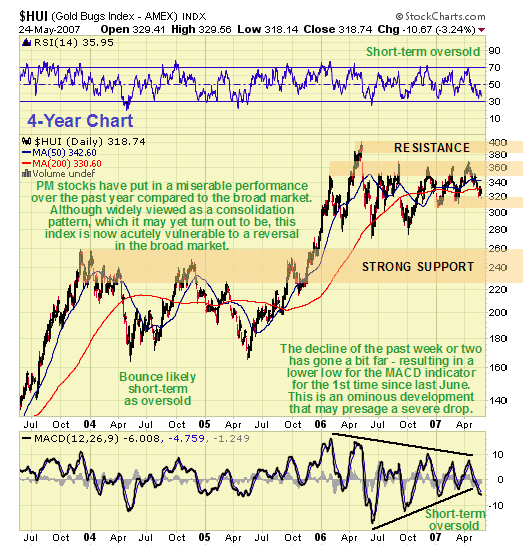
On the 4-year chart for the HUI index we can see that while the broad US stockmarkets, and other world markets, have made good progress over the past year, gold and silver stocks as a group have gone nowhere - their repeated feeble attempts to break higher all having failed. Their performance can only be described as miserable, and it is not at all a hopeful sign that whenever the broad market has shown signs of weakness or dropped, the Precious Metals stocks indices have fallen, at times quite sharply. The action over the past year does look like a large consolidation pattern, and many pundits are touting it as that, yet it hard to see how this index can do anything but get hammered if world markets go into freefall precipitated by a collapse in China. Although now oversold as shown by the short-term indicators at the top and bottom of the chart, for the 1st time since last June the MACD indicator has dropped to a lower low on this latest decline, which may presage a severe decline, probably after a bounce first.
Given the serious risks inherent in the current situation for Precious Metals share investors, a clear plan of action should be in place, so that if the domino effect of a Chinese market cave-in followed by a severe downturn in US markets leading to a probable plunge in the PM sector occurs, you are quickly taken out of most positions and escape relatively unscathed. Fortunately with important nearby support and resistance clearly defined, it is easy to set an exit point. A drop below the early January low at 306 will be viewed as generating a general sector wide sell signal, which should implemented on a close below say 295. The least that such a break would be expected to lead to is a retreat back to the strong support in the 230 - 60 area, and depending on general market conditions prevailing at the time, it could drop significantly lower. The other side of the coin is that a break above the heavy resistance in the 360 - 370 area will begin to open the door to the prospects of a major uptrend developing, although if it should drop back below this level it will be viewed as a failed breakout and thus a major sell signal.
During the prolonged period of stagnation in this sector we have largely avoided no-hoper stocks like Newmont Mining on www.clivemaund.com opting instead to go where the action has been in the smaller issues. All investors in the sector need to be aware that should we see a major meltdown soon in the Chinese and US markets, as is looking increasingly probable, it is likely to take down most resource stocks, and few will escape without damage. Plan accordingly. We will be looking at Put option strategies both for portfolio protection and speculative gain on the site shortly.
By Clive Maund
CliveMaund.com
© 2007 Clive Maund - The above represents the opinion and analysis of Mr. Maund, based on data available to him, at the time of writing. Mr. Maunds opinions are his own, and are not a recommendation or an offer to buy or sell securities. No responsibility can be accepted for losses that may result as a consequence of trading on the basis of this analysis.
Mr. Maund is an independent analyst who receives no compensation of any kind from any groups, individuals or corporations mentioned in his reports. As trading and investing in any financial markets may involve serious risk of loss, Mr. Maund recommends that you consult with a qualified investment advisor, one licensed by appropriate regulatory agencies in your legal jurisdiction and do your own due diligence and research when making any kind of a transaction with financial ramifications.
© 2005-2022 http://www.MarketOracle.co.uk - The Market Oracle is a FREE Daily Financial Markets Analysis & Forecasting online publication.


