Debt Fuelled Tax Payer Bailouts and Economic Stimulus: If You Believe Borrowing Leads to Prosperity
Economics / US Debt May 06, 2009 - 07:57 PM GMTBy: James_Quinn
 The 1970’s were a simpler time. As kids, we listened to All The Young Dudes by Mott the Hoople on our portable record players. We would cut Monkees’ .98s from the back of our Raisin Bran cereal boxes. There were maybe ten TV stations we could watch. For entertainment we would play board games like The Game of Life, Monopoly, and Risk. I remember having a two day Risk match with friends from our neighborhood. Our parents didn’t smother us with attention. We created our own fun. We organized our own roller hockey league with games played in our back alley and on the side streets of our neighborhood. We played half-ball against the back of our row homes.
We organized our own pickup basketball games on the playground, running for three hours and refereeing the games ourselves. There were five baseball fields within a mile of our house where we could play for hours with our friends. When we played organized sports there were winners and losers. We routinely would leave the house in the morning and not return until dark. I was allowed to ride my bike the three miles to school through the cemetery and across highways and trolley tracks. Money didn’t matter at all in generating happiness. We had enough for two weeks in Wildwood. That was more than enough for me. Between then and now, something has gone terribly astray.
Mott the Hoople and the Game of Life. Yeah, yeah, yeah, yeah
Andy Kaufman in the wrestling match. Yeah, yeah, yeah, yeah
Monopoly, twenty one, checkers, and chess. Yeah, yeah, yeah, yeah
Mister Fred Blassie in a breakfast mess. Yeah, yeah, yeah, yeah
Let's play Twister, let's play Risk. Yeah, yeah, yeah, yeah
See you in heaven if you make the list. Yeah, yeah, yeah, yeah
Man on the Moon – REM
Today, we can download Mott the Hoople songs in an instant, for $.99 onto our $250 iPods and then play them on our $100 iPod speaker system. For a mere $200 a month we can have the Comcast HD triple play bundle of 1,000 stations, HBO, Showtime, Cinemax, Starz, Sports packages, internet service and VOIP. Why play a board game and interact with other human beings when you can turn on your $399 PS3 console and kill as many fake human beings in 3 hours as possible. When you are tired of that game, just whip out the credit card and download a new game for $39.99. Our kids today are over scheduled, over indulged, over protected, and under prepared for the future we are leaving them.
Today, we pay $200 per sport to sign our kids up at the age of 5 for little league baseball, ice hockey, soccer, football, and basketball. Kids get trophies for just playing. Everyone is a winner in the politically correct world of today. Kids don’t have the time or inclination to organize their own pickup games. Kids catch a bus to a school that is two blocks way. A $10,000 vacation in Disney World or Cancun is now the standard family vacation. We’re raising marshmallows and we are handing them a country that is in the midst of a debt induced death spiral. How did we get here?
Brain Gets Smart but Your Head Gets Dumb
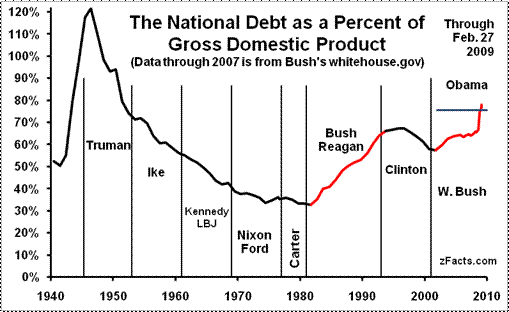
The National Debt is currently $11.2 trillion or 80% of GDP for the 1st time since Harry Truman was President. Based on the usually underestimated CBO deficit estimates, the National Debt will exceed $14 trillion in 2012. The National Debt will be close to 100% of GDP for the 1st time since WWII. In the 1940’s we were engaged in a war of survival and needed to borrow to produce the tanks, planes, ships and guns to win the war. There are a couple small differences between the 1940’s and today. The government borrowed all the funds from its patriotic citizens through the issuance of war bonds. The Personal Savings Rate was 25% during the war. Today, we are attempting to borrow hundreds of billions from China, Japan, and the Middle East. The Personal Savings Rate has risen from below 0% to 4% today. At the end of the war, the United States dictated the economic future of the world, producing the goods the rest of the world needed. Today, we are the biggest debtor nation in the world. We no longer dictate the economic terms to the rest of the world. Our government and citizens have fallen for the same misguided advice. Live for today and don’t worry about tomorrow.
Well the years start coming and they don't stop coming
Back to the rule and I hit the ground running
Didn't make sense not to live for fun
Your brain gets smart but your head gets dumb
The ice we skate is getting pretty thin
The waters getting warm so you might as well swim
My world's on fire how about yours
That's the way I like it and I never get bored
All Star – Smash Mouth
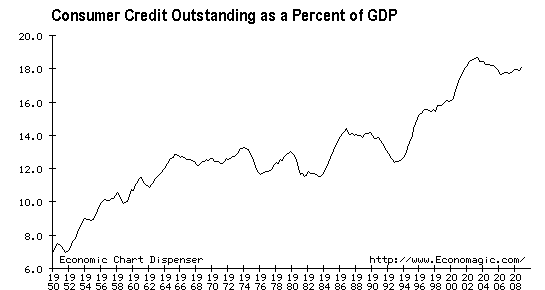
Based on the chart below it is clear that our heads got dumb starting in the early 1970s and with the onslaught of our “smart” MBA brains to Wall Street in the early 1990s, securitization led the charge to our ultimate destruction. Consumer credit outstanding grew from $169 billion in 1975 to $2.6 trillion in 2008, a 1,400% increase in 33 years. Over this same time frame US GDP grew from $1.6 trillion to $14 trillion, a 800% increase. Personal consumption expenditures rose from $1.0 trillion to $10 trillion, a 900% increase. Consumer expenditures accounted for 63% of GDP in 1975 versus 70.5% in 2008. Houston, we’ve got a problem.
When Nixon closed the gold window in 1971, the Federal Reserve was free to print as many dollars as they desired with no constraints. It took a little while to get going, but once consumers and politicians realized they could spend whatever they wanted today with no adverse consequences, they were off to the races. I find it amusing that with consumers owing $2.6 trillion in consumer debt (approx. $23,000 per household), unemployment soaring, wages stagnant, home prices plummeting, and retirement savings obliterated, the talking heads on CNBC are calling for a consumer led recovery in 2009. An unsustainable trend will not be sustained. Regression to the mean has commenced.
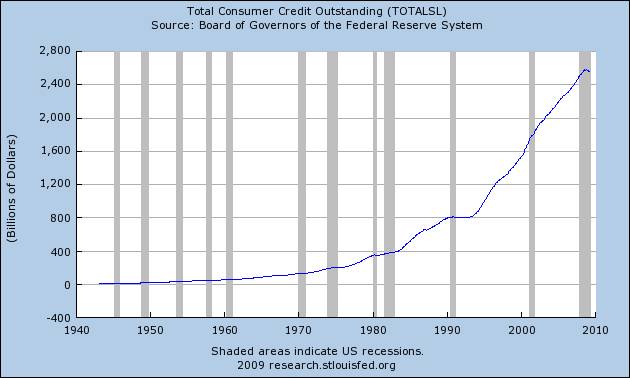
The most revealing aspect of the consumer debt outstanding statistics between 1975 and 2008 is the fact that up until 1990 consumer borrowing was done through traditional outlets of commercial banks, finance companies and credit unions. The wizards of Wall Street took consumer debt to a new level in the early 1990s. These geniuses figured out with their financial models they could package consumer debt into pools and sell it to pension funds, mutual funds, little towns in Norway, and anyone who wanted a great return with “no risk”.
This new financial product led to a surge in credit card issuance by the major players in the industry. The MBAs assured everyone that even debt from subprime borrowers could be turned into gold by packaging it just so. Like any ponzi scheme, this consumer debt scheme needed more and more debt issuance to cover the increasing bad debt in the portfolios. Once the market for buying the pools of toxic debt seized up in 2008, the game was over. Another interesting aspect is that while the coming crisis was clearly seen by smart analysts like John Hussman, John Mauldin, and Jeremy Grantham in 2005, Commercial Banks and the Government ramped up their lending by 24% between 2005 and 2008. Credit unions, savings institutions and non-financial businesses decreased their risk exposure. The biggest and brightest made the riskiest bets at the exact wrong time. Did they do this because they knew the Fed would bail them out? I think the proof has been borne out.
Consumer Credit Outstanding1
(in billions of dollars)
| Total | Commercial banks |
Finance companies |
Credit unions |
Federal government and Sallie Mae |
Savings institutions |
Nonfinancial business |
Pools of securitized assets2 |
|
| 1975 | $168.7 | $82.9 |
$32.7 |
$25.7 |
n.a |
n.a. |
n.a. |
n.a. |
| 1980 | 302.1 | 147.0 |
62.3 |
44.0 |
n.a |
n.a. |
n.a. |
n.a. |
| 1985 | 526.3 | 245.1 |
111.7 |
72.7 |
n.a |
n.a. |
n.a. |
n.a. |
| 1990 | 751.9 | 347.1 |
133.3 |
93.1 |
n.a |
n.a. |
n.a. |
n.a. |
| 1995 | 1,122.8 | 502.0 |
152.1 |
131.9 |
n.a |
$40.1 |
$85.1 |
$211.6 |
| 2005 | 2,313.9 | 707.0 |
516.5 |
228.6 |
89.8 |
109.1 |
58.8 |
604.0 |
| 2006 | 2,418.3 | 741.2 |
534.4 |
234.5 |
91.7 |
95.5 |
56.8 |
664.2 |
| 2007 | 2,551.9 | 804.1 |
584.1 |
235.7 |
98.4 |
90.8 |
55.2 |
683.7 |
| 2008 | 2,596.9 | 878.5 |
575.8 |
235.0 |
111.0 |
86.3 |
55.6 |
654.7 |
1. Covers most short- and intermediate-term credit extended to individuals, excluding loans secured by real estate.
2. Outstanding balances of pools on which securities have been issued; these balances are no longer carried on the balance sheets of the loan originators. n.a. = not available.
Source: Federal Reserve Board. Web http://www.federalreserve.gov/default.htm.
Credit Card With No Limit
I'll need a credit card that's got no limit
And a big black jet with a bedroom in it
Rockstar – Nickleback
We all deserve to live like rock stars. We just need a credit card with no limit. If you can’t get one credit card with no limit, get 20 credit cards with a $10,000 limit on each and the sky’s the limit. According to myfico.com, the average consumer has a total of 13 credit obligations on record at a credit bureau. These include credit cards (such as department store charge cards, gas cards, and bank cards) and installment loans (auto loans, mortgage loans, student loans). Of these 13 credit obligations nine are likely to be credit cards and four are likely to be installment loans.
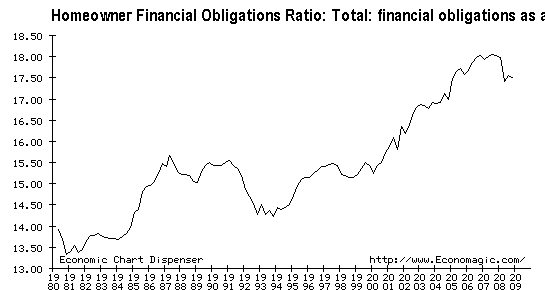
Between 1980 and 2000 13.5% to 15.5% of American’s disposable income went towards debt payments for mortgages, credit cards, auto loans and personal loans. From 2000 until 2008, with the help of the Federal Reserve, the top 10 credit card issuers, the auto financing arms of GM, Ford & Chrysler, and President Bush’s defeat terrorism by buying an SUV cheerleading, consumer debt payments skyrocketed to 18% of disposable income. Disposable personal income in 2008 was $10.6 trillion. Therefore, consumers paid $1.9 trillion towards debt obligations. To achieve normalcy, consumers will need to reduce their obligations to 15% of disposable income. This would require a reduction in debt payments of $300 billion. A massive consumer deleveraging will be required to reach this level.
President Obama, Ben Bernanke, and Timmy Geithner need the consumer to keep doing their part in this colossal ponzi scheme. They want consumers to borrow and spend as if nothing has happened in the last 18 months. Consumer spending has accounted for 70% of our $14 trillion GDP, or close to $10 trillion. In order for the Americans to have a chance at a decent standard of living in their old age, they will need to reduce annual spending by $1 trillion per year and use that money to pay off debt. According to the Nilson Report at the end of 2008, Americans' credit card debt reached $972.73 billion. That number includes both general purpose credit cards and private label credit cards that aren't owned by a bank. The average outstanding credit card debt for households that have a credit card was $10,679 at the end of 2008. To get consumer debt as a percentage of GDP to a manageable level of 13% will require deleveraging in the neighborhood of $700 billion. This doesn’t include mortgage debt. These aren’t the green shoots you’ll hear from Larry Kudlow.
You may think all of this credit card debt is spread throughout the banking system. Wrong my friend. According to the Nilson Report, the top 10 U.S. credit card issuers held an 87.6% market share of $972.73 billion in general purpose card outstanding in 2008. That includes Visa, MasterCard, American Express, and Discover. See if you recognize any of these fine institutions.
General purpose credit card outstandings market share 2008
Bank Taxpayer Funding
1. JPMorgan Chase - 21.22% $25 bil.
2. Bank of America - 19.25% $52.5
3. Citigroup - 12.35% $50
4. American Express - 10.19% $3.4
5. Capital One - 6.95% $3.6
6. Discover - 5.75% $0
7. Wells Fargo - 4.21% $25
8. HSBC - 3.47% $0
9. U.S. Bank - 2.14% $6.6
10. USAA Savings - 2.02% $0
These 10 banks control virtually the entire credit card market. These 10 banks have taken $166 billion of taxpayer money while continuing to send out 5 billion credit card solicitations per year. The Federal Reserve demands these banks keep the credit flowing. Fitch's Charge-Off Index, which tracks the write-down of uncollectable debt by credit card firms, climbed 101 basis points to a record 8.41% in February. That eclipsed the prior mark of 7.52% reached in November 2005 during the spike in bankruptcy filings. Credit card delinquencies shot to a record high of 4.33% in February.
Meredith Whitney, the outstanding bank analyst, had this to say, "This is the most interesting topic for me out there, which is credit card lines. So, there are about $4.2 trillion in unused credit card lines. And there are about $840 billion of used credit lines. In the fourth quarter alone, half a trillion dollars of lines were cut from the consumer -- half a trillion. As Americans face layoffs and pay cuts, they're turning to their credit cards to make up the difference. These cuts in unused credit lines amount to cuts in compensation.” Her gloomiest forecast is for a 50% cut in unused credit lines. The cutting of credit lines and absolute need for consumers to reduce debt will put a lid on the consumer economy for the next five years.
Hilltop Houses Driving Fifteen Cars
'Cause we all just wanna be big rockstars
And live in hilltop houses driving fifteen cars
Rockstar – Nickleback
Americans love their cars. Americans are their cars. The impression of achievement and elevated social status are conveyed by the car you drive in the minds of many Americans. If you want your neighbors, friends, work colleagues and perfect strangers to think you are a success, just tool around in a $50,000 Mercedes SUV. This damn economy is forcing these socially conscious auto worshippers from following their normal two year trade up cycle. The result is that auto sales have plummeted from an annual rate of 16 million to a current rate of less than 10 million. These short sighted people have allowed the temporary psychological benefits of driving a car they can’t afford to outweigh their long-term financial future. Millions have made this choice. Now that the debt bubble has imploded, the government is pouring billions of taxpayer funds into the auto financing companies like GMAC to try and re-inflate the bubble. Only a fool would buy into it. Luckily, this country has no shortage of fools.
![[VehicleSalesApril.jpg]](/images/2009/May/borrowing-6_image007.jpg)
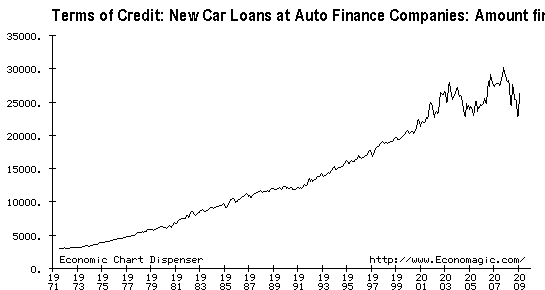
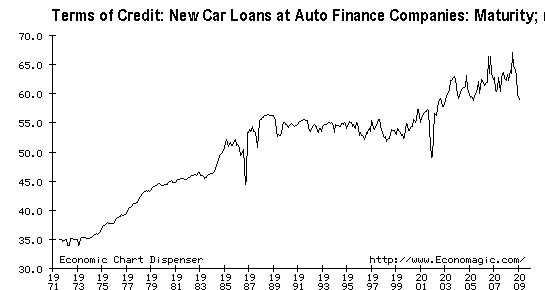
The great American consumer has changed their car buying habits over the decades. In the 1970’s they saved up the 20% down payment and then financed the remaining balance over 3 or 4 years. With an average loan of $4,000 to $8,000, the burden was not great. After 4 years, they owned the car free and clear. They would then drive their American built car until it fell apart, usually around 90,000 miles. In 2008, the average new car loan topped out near $30,000. In comparison, the median home price was $17,000 in 1970.
The $30,000 average car loan was made manageable by the “creative” auto financing arms of the Big 3 extending loans to 6 or 7 years. This worked fine for the trader uppers in our society. They wouldn’t be caught dead driving a 7 year old car. It was a beautiful deception. Car buyers deluded themselves that the debt didn’t matter and the car companies deluded themselves that the loans would be repaid. A perfect combination to sell 16 million cars per year for all eternity. When the return customer came into the dealership to trade up after two years, the dealers were perfectly willing to roll the unpaid loan balance into the new deal. Presto!!! We’ve got millions driving cars with a Loan-To-Value of 140%. How could this possibly fail? According to JD Power, there are now 6 million people who are underwater on their car loan. When this Ponzi scheme collapsed, car sales plummeted 40% and GM and Chrysler have been revealed as bankrupt disasters.
This brings us to the most irrational financial move anyone can make, leasing a car. Estimates are that 25% to 30% of all car sales have been leases. This is 4 to 5 million per year. The most leased cars in 2008 according to LeaseTrader.com were:
MSRP
1. BMW 3 Series $40,000
2. Mini Cooper $25,000
3. Mercedes C Class $35,000
4. Toyota Camry $25,000
5. Cadillac CTS $40,000
6. Mercedes SL Class $50,000
7. Land Rover LR3 $50,000
8. Lexus IS 250 $35,000
9. BMW X Series $40,000
10. Mercedes GL Class $60,000
This list substantiates that most people’s need for appearing more successful outweighs the benefits of living within your means and saving for the future. Personally, I want to be financially secure rather than appear to be financially secure. I’m evidently in the minority. A car loan payment over four years that would normally be $399 a month can be $249 a month with a lease, which is very appealing to those who insist on driving a new car. The difference is that you own the car after four years with a loan. With a lease you become an indentured servant, forever indebted to the car company master. The financial reasons for not leasing are numerous:
- A lease starts a trend of perpetually paying a car payment. If you never paid a car payment and the average car payment in America was $350 a month, putting that $350 a month in a mutual fund that made 10% would become $791,171 in 30 years.
- If you get in an accident and the vehicle is totaled, you’ll still be responsible to pay back the full lease contract amount. Even if the insurance company gives you back less than what you owe to the dealership, you’ll be responsible for the full amount.
- Many times, the lease agreement will be for 5 years/60,000 miles. So, if you go over that 60,000 and keep it until the 5 years is up, you’ll pay a penalty for every mile over 60,000 miles. Most people use well over 12,000 per year.
- If you lose a job or experience a heavy time of financial hardship and cannot afford the payment anymore, the dealership will recover the car, sell it an auction, and if they sell it for less than you owe for the lease agreement, you will be legally responsible to pay the difference.
- The car is not yours, yet they still make you pay for the maintenance of it. Again, you can’t claim the car as an asset. It is technically still an asset of the dealership that leased it to you.
- If you decide to take the option to buy the car at the end of the lease term, you’ll have paid much more than the cost of the car even if you had financed it.
In order to get ahead in life you need to invest in assets that appreciate, not depreciate. Does the appearance of wealth and success really outweigh actually being wealthy and successful? Driving a $50,000 car doesn’t guarantee happiness. If it did, we’d be the happiest country on earth. Looking marvelous is a shallow, shortsighted way to go through life. That is fine for those who choose that route, but I’m tired of picking up the pieces of their shattered lives with my tax dollars.
Illusions
The biggest and most dangerous illusion for Americans today is that everyone deserves to be a winner. Everyone does not deserve a trophy just for playing. If you screwed up, didn’t work hard, didn’t save for a rainy day, and didn’t save for your retirement, then you lose. The winners studied, worked hard, lived within their means, and saved for the future. The winners have the option to help the losers through charitable means. If the government forces the winners to pay for the bad choices of the losers, our economic system is worthless. This is the reason that anger is building in the country. The Tea Parties were not about taxes. They were about anger towards our government for rewarding the profligate at the expense of the frugal.
Comedian Andy Kaufman died in 1984 at the age of 35 from lung cancer, even though he never smoked a day in his life. Did he really die? Did we really put a man on the moon? Andy was the master of illusion. Audiences never knew whether he was serious or joking. Next time you are at a truck stop take a look around. Andy might be there with Elvis. The American government and its citizens have to get over their illusion that they can spend their way to prosperity. According to Zillow.com 33% of all homeowners with a mortgage owe more than the home is worth. At least 67% of all homeowners with a mortgage have 15% equity or less in their homes. The average household has $23,000 of consumer debt. Six million car “owners” owe more than the car is worth. The median 401k balance is less than $15,000. Any economic recovery that is dependent on consumers to borrow and spend will just be a fool’s errand. The illusion of prosperity is coming to a tragic end.
Hey Andy, did you hear about this one?
If you are seeking the truth, join me at www.TheBurningPlatform.com .
By James Quinn
James Quinn is a senior director of strategic planning for a major university. James has held financial positions with a retailer, homebuilder and university in his 22-year career. Those positions included treasurer, controller, and head of strategic planning. He is married with three boys and is writing these articles because he cares about their future. He earned a BS in accounting from Drexel University and an MBA from Villanova University. He is a certified public accountant and a certified cash manager.
These articles reflect the personal views of James Quinn. They do not necessarily represent the views of his employer, and are not sponsored or endorsed by his employer.
© 2009 Copyright James Quinn - All Rights Reserved
Disclaimer: The above is a matter of opinion provided for general information purposes only and is not intended as investment advice. Information and analysis above are derived from sources and utilising methods believed to be reliable, but we cannot accept responsibility for any losses you may incur as a result of this analysis. Individuals should consult with their personal financial advisors.
James Quinn Archive |
© 2005-2022 http://www.MarketOracle.co.uk - The Market Oracle is a FREE Daily Financial Markets Analysis & Forecasting online publication.


