


Why Stock Market 2009 is Turning Out to be a Repeat of 1975
Stock-Markets / US Stock Markets May 06, 2009 - 11:58 AM GMTBy: Clif_Droke

 The impressive recovery in the S&P 500 index to date has been brought to us courtesy of a massive shift in the market’s internal rate of change. This was characterized by the extreme diminution of stocks making the new 52-week lows list on the NYSE since the early March bottom.
For instance, in February and heading into March the number of stocks making new lows was frequently above 100 and sometimes above 300, hitting an extreme of 704 new lows on March 5 around the time of the bear market price low. From there the number of new lows shrunk dramatically and by March 12 -- the day we went long the stock market via the Ultra S&P 500 ETF (SSO) – there were zero new lows. From then until now the number of new lows has consistently been under 10 or 15 at the most.
The next rally leg will undoubtedly come from an expansion in the number of stocks making new 52-week highs. This should be catalyzed by the bottoming of the interim weekly Kress cycle in a few days and once we have confirmation of its kick-off we will likely see an even more amazing stage of the market’s recovery. Many investors are deluding themselves into thinking this was a mere “sucker’s rally” in an ongoing bear market but they will be surprised when they learn, belatedly, that the March-April rally leg was only the first portion of a continued cyclical recovery.
For some time now I’ve been emphasizing the importance of the year 2009 as a time for making money on the long side of the stock market, particularly the months leading up to the peaking of the major 10-year Kress cycle. What makes this year so important? Aside from the fact that equities are coming off their worst thrashing since the 1929 crash, and hence more oversold at anytime since then, this year is when the aforementioned 10-year cycle peak combines with the newly formed 6-year cycle ascent. As I mentioned in a recent report, the interaction between the 6- and 10-period cycles (weekly as well as yearly) is one of the more important cycle interactions in the Kress cycle series.
For instance, is it any coincidence that the best equities performance of our lifetime was back in 1975? Then, as now, the market was coming off a greater than 40% decline with the bottom made in the latter part of 1974 just as the 10-year cycle was bottoming. For the year 1975 the newly formed 10-year up cycle combined with the peaking 6-year cycle that year to bring about a 100% rally in the broad market.
Fast forward to 2009 and what is the cyclical configuration we’re faced with but a peaking 10-year cycle and a newly formed 6-year up cycle. This is the opposite of what it was in 1975 but it’s still a bullish combination since both these key cycles are in the ascent for the first several months of 2009. Is it any coincidence then that the stock market has had its second best rally since 1938 so far this year (only the ’75 rally has trumped this one)? With the yearly cycles still supporting a recovery into the third quarter, the odds are we haven’t seen the end of this amazing (in percentage terms) turnaround.
Let’s take a look at some of the leading economic indicators among the individual stocks in our New Economy Index (NEI). Some of them are pointing to a promising recovery in the U.S. retail economy, notwithstanding the sluggard nature of the current economy.
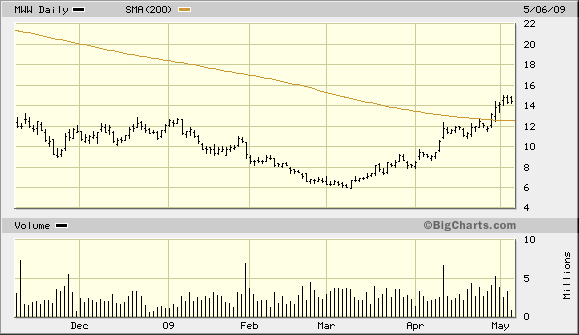
To take one prominent example, Monster Worldwide (MWW) is now above its 200-day moving average for the first time since June 2007, which was around the time when the previous bull market peaked out internally along with the economy. With MWW showing strength it points to a recovery in the job market outlook in the months ahead. My best guess is that by July we should start to see a modicum of improvement with even more signs of improvement by the fourth quarter.
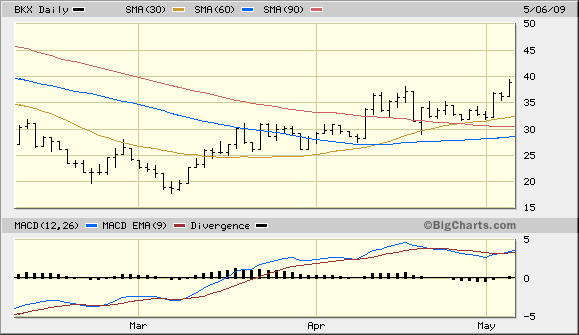
If there is to be an economic recovery this year it will almost certainly begin with the sector that began the crisis in the first place, namely the lending institutions. Recovery must begin with the banks. Banks have to start lending again before we can see the wheels of commerce turning in a big way. The bank stocks are showing definite signs of recovery and hopefully this will result in an increased willingness to lend.
The Bank Index (BKX) is showing the classic signs of an intermediate-term turnaround. Recovery in the bank shares paves the way for increased lending activity, just as it did in the previous market recovery in
Our assertion earlier this year that China would most likely lead the U.S. out of economic recession is starting to come to fruition as China shows greater economic and financial market stability in the midst of global weakness. China still relies on the U.S. as its leading customer and as the wheels of industry in China gradually pick up steam, the U.S. will be expected to do its share to continue the Chinese “economic miracle.” That’s why the U.S. economic stimulus will work, notwithstanding the pessimistic comments among analysts who say the bailout has already failed. The “Powers-That-Be” have determined that the bailout will work and what the PTBs want, the PTBs get!
Here’s what the iShares China 25 Index Fund (FXI, 35.16) looks like after Monday’s rally of 9%. Note the emerging bullish structure of the 30/60/90-day MA series in this chart.
One of the reasons why so many traders went short the broad market in April is because of the residual or spillover effect from the previous bear market decline. Traders had become complacent with shorting the market every time the economy showed signs of weakness that they began to assume the market would continue trending lower off the lack of economic strength. Yet the market is a forward looking creature and when the yearly cycles turn up along with internal momentum, the market tends to shrug off negative economic headlines as it focuses on the improvement it anticipates anywhere from 6-9 months into the future. Investors look around them and see unemployment everywhere and housing market woes, yet the market isn’t looking at these obvious factors that are plain to everyone. It looks at those signs that are less visible to the crowd right now but will be plainly evident in the months to come.
Already we see evidence that the market anticipates some level of recovery in the housing market. The Dow Jones REIT Index (DJR) continues its pattern of higher highs and so does the Philly Housing Index (HGX). This suggests the housing market will see some recovery later this year.
Says Briefing.com: “According to the latest batch of U.S. economic data, pending home sales for March advanced a better-than-expected 3.2% month-over-month….As for construction spending in March, it increased 0.3% month-over-month, exceeding the 1.6% decrease that was expected. In turn, the March report will likely make an incrementally positive contribution to first quarter GDP revisions.”
By Clif Droke
www.clifdroke.com
Clif Droke is the editor of the daily Gold & Silver Stock Report. Published daily since 2002, the report provides forecasts and analysis of the leading gold, silver, uranium and energy stocks from a short-term technical standpoint. He is also the author of numerous books, including 'How to Read Chart Patterns for Greater Profits.' For more information visit www.clifdroke.com
Clif Droke Archive |
© 2005-2022 http://www.MarketOracle.co.uk - The Market Oracle is a FREE Daily Financial Markets Analysis & Forecasting online publication.