The Great Asset Bubble Built on Debt
Economics / US Debt May 01, 2009 - 12:18 PM GMTBy: Dr_Martenson
 Where are we going, and what lies next? To address these questions, we need to know how we got here in the first place.
I want to share with you an interesting observation that I think will provide great clarity and insight into our current predicament, as well as indicate that our recovery, such as it is, will be protracted and incomplete.
It begins with our old friend, the Debt-to-GDP chart (below), with our long-term average circled in green and our recent debt experiment in red. Today we're going to focus on what happened there in the 1980s, when we began our long climb to our current levels of over-indebtedness.
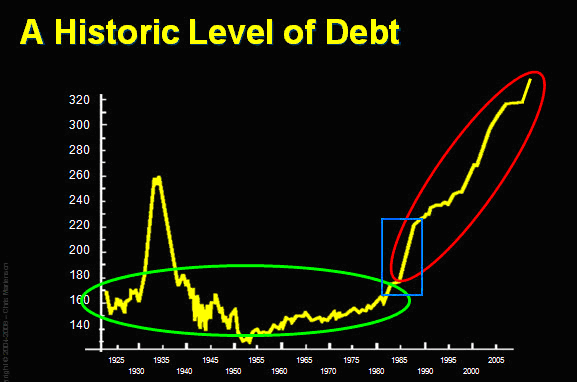
Now, this is not a partisan statement by any means, because both parties played along, but Ronald Reagan's terms in office (1981-1989) are marked by the blue box. It was during his tenure that we initially began our experiment with ever-larger piles of debt. Somewhere in the early 1980s, we clearly broke out of a long-established normal range of debt and into new territory. Something happened there, but what?
Before I explain, let's make a few additional observations. What else was in play in the same timeframe that debt was exploding?
First, we must remember the US personal savings rate, which, as noted in the Crash Course, was inversely correlated (to a very high degree) during the same timeframe. As debt was climbing, savings were falling in lockstep.
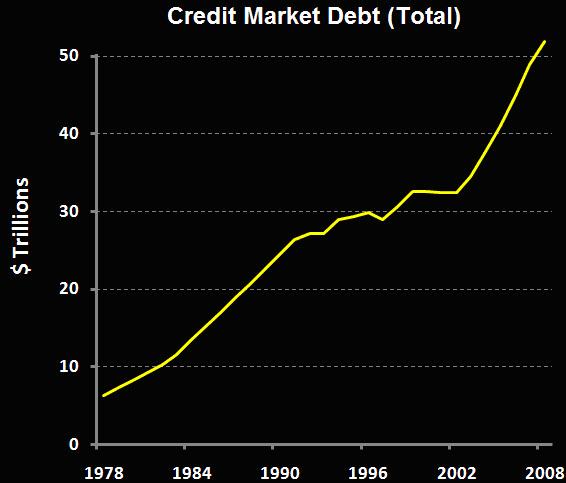
Note in the image above that the erosion in savings began sometime in the early 1980s, slumping inexorably towards zero the rest of the way. But I want to be careful here in how I associate the first chart (above, the Debt-to-GDP chart) with this chart of savings. Certainly, they appear highly correlated, but this is not the same as saying one is the cause of the other. Correlation is not causation, and we should always endeavor to be careful to distinguish the two. Still, there is a very tantalizing symmetry between the two that bears exploration.
If I were to speculate, I would guess that the erosion in personal savings was not tied directly to debt, but to a sense of wealth and well-being. The Fed has produced plenty of research papers investigating something called "the wealth effect," which is the degree of additional consumer spending that can be estimated to occur as a direct consequence of rising asset prices.
For example, the Fed estimates that for every dollar rise in someone's stock portfolio, an additional 7 cents of consumer spending will result. The idea here is that people who perceive themselves to be wealthier will spend more than people who do not. That seems like a fairly defensible notion.
The wealth effect is a theory that has its fair share of critics, but it seems possible that people whose assets are rising steadily in price might feel less and less compelled to save money in the bank. Additionally, we could also consider that people with expanded access to credit for managing their cash flow might perceive less of a need to maintain a cash buffer in the form of savings. Credit becomes the buffer, especially if it's ubiquitous and easy to get.
Taken together, the decline in savings shown by the above chart could be attributed to an explosion of credit and generally rising asset prices. Perhaps we could also speculate that the federal government set a bad example during this same period of time and thereby laid the cultural foundation for spending and living "in the moment." Regardless of the reason(s), this phenomenon of zero savings has set the stage for what comes next, and we'll be tying this lack of savings back into the story a bit further down.
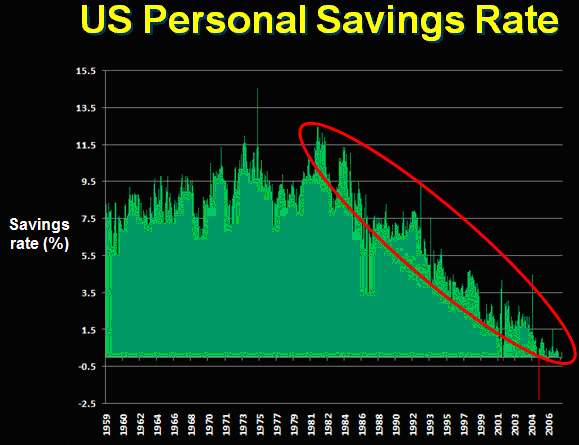
This next chart of total credit market debt illustrates the rapid and unprecedented expansion of debt over the past 30 years. This chart is really just a means of viewing the debt portion only of the Debt-to-GDP chart since it's the same data. But here it's easier to see the slight ripples in the data in the mid-1990's that led Alan Greenspan to panic and open the credit floodgates that are directly responsible for much of the condition in which we currently find ourselves.
Now let's look at these next two charts, each spanning the last 30 years, with one for stocks and the other for bonds. In both cases, a rising line means a rising price. In short, both stocks and bonds entered a sustained bull market in the early 1980's and remained there for the next twenty years (stocks) to thirty years (bonds).
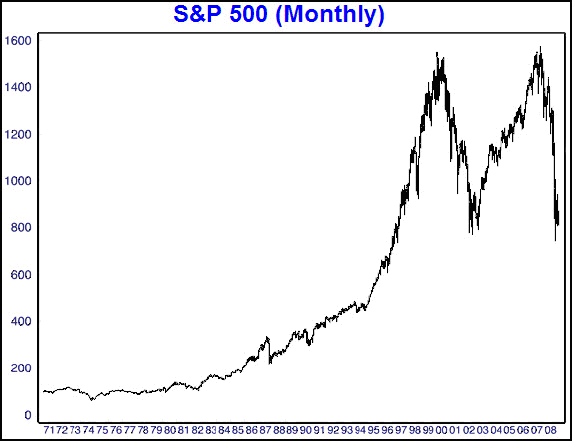
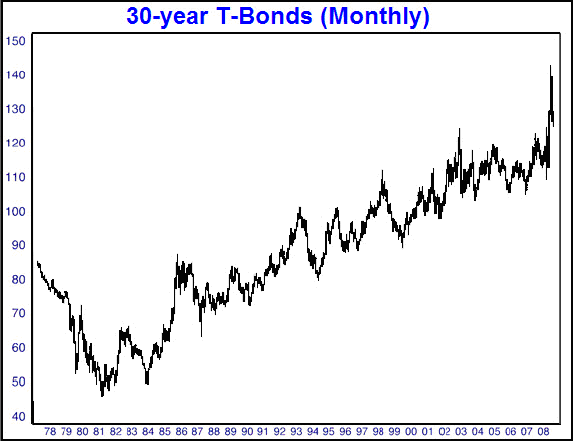
A sustained bull market in both stocks and bonds is one of those things that cause me to scratch my head and want to dig a little deeper.
All of these charts collectively encompass my entire experience as an investor, my time as an adult, and even some of my teenage years. This means that I have spent nearly all of my life, year in and year out, living under a system of ever-larger debts, steadily higher bond prices, and stock prices that rose magnificently until 2000. If I put housing prices on here, they would look like the bond prices, only steadier in their rise, and steeper, too, as they have doubled and doubled again over the past 30 years.
How do we explain this? What can account for stocks, bonds, and housing going up while savings went down? Can we simply understand this as the natural result of a sustained credit bubble?
The credit bubble is only a partial explanation. To complete the story and understand why we face years of readjustment, we have to include the boomers.
The Baby Boomers
According to Wikipedia, "Influential authors William Strauss and Neil Howe label American Baby Boomers [as people born between the years] 1943 and 1960." This means that in 1980, the youngest boomer was 20, the oldest was 37 and the average was 28.5 (see table below).
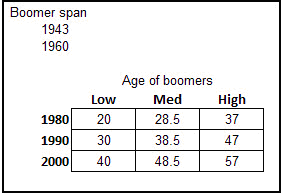
Why is this important? Because the boomers are the largest single demographics cohort in American history, and they have exerted many well-characterized influences on politics and social structure. I won't go into any of that here, but will instead focus on what I view as the underappreciated economic and financial impacts of the boomer crowd.
The relevant detail here is that a person's income begins at a level of zero, and (on average) rises steadily to a point before declining throughout old age back towards zero. Where is the peak of earnings?
Again from Wikipedia, "Two decades ago, the peak earning years were between 35 and 44. Now they occur ten years later. Twenty years ago, those in their peak earning years took home about twice as much as workers between the ages of 20 and 24. Now they earn more than three times as much."
So peak earnings lie between the ages of 35 to 55 over the period we are discussing (1978 onwards).
This means that in 1980, when stocks and bonds and housing all began their journey into the wild blue yonder, the oldest of the baby boomers were just entering their peak earning years. What might we predict to be the collective impact of a gigantic demographics bolus moving through its peak earning years?
Well, accumulating savings and investing in such things as stocks, bonds, and houses are both highly correlated with earning power. Extrapolating across an entire generational demographic bulge, we might readily defend the idea that rising asset prices were at least partially, if not largely, driven by the rising earning power of the boomers.
Now let's take another look at the 30-year stock chart with the boomers' peak earning years (loosely defined as the time when the middle range of the boomer demographic was between 35 and 50 years old) marked upon it:
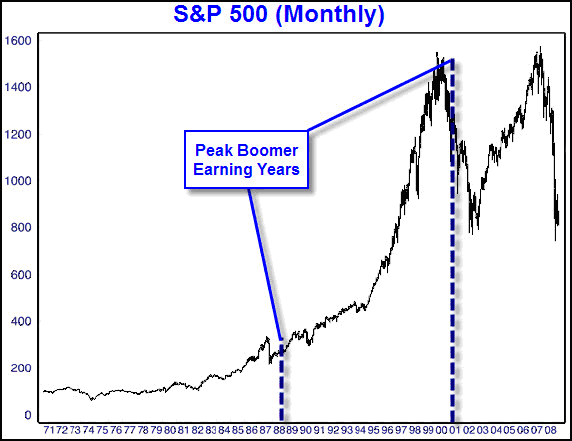
Again, this might be a matter of correlation, not causation, but if the rise in stock prices witnessed over the late 1980s, 1990s and early 2000 timeframe was in large part due to a demographic bulge, then we could readily predict that stocks and bonds (and houses and everything else) will not be a sure-fire path to wealth in the future like they were in the past.
However, what goes up must come down. Those who save for retirement must also spend in retirement. So I invite you to consider the idea that our common experience with paper assets might be explained as a demographic dividend, as much as by the inflationary policies of the Federal Reserve or the fact that ample oil reserves were available to supply the economic expansion.
If this thesis holds, then here's what we might predict:
Tailwind of boomer investment turns into headwind of disinvestment
As mentioned in the Crash Course (in Chapter 14 - Assets and Demographics), there seems to be a slight problem in the model where one generation sells off its assets to the generation behind them. When there are more sellers than buyers, prices fall, and when there are more buyers than sellers, prices rise. So I must ask the question, "What will happen when the boomers seek to unload their assets to fund their retirements?" It seems entirely likely that we could see more sellers than buyers for a while. I am anticipating that this will create a sustained headwind that will grind down asset prices until a more proportional relationship to production is struck.
The great illusion created by the demographically-driven rise in asset prices was the notion that one could park excess money in some form of paper or housing asset and "get wealthy" over time. For a while, it seemed so simple. Buy the right index fund and sit back and wait. Just buy a house and wait. Just pick the right stock and wait. That's all it took to ‘get rich.' Right?
But if you stop and think about it, this is really not possible, at least not in aggregate and certainly not over the long haul. It is a cheap, temporary illusion. Real wealth is created by people producing things. Once a company has sold stock through a primary offering, no new capital is "invested" in the company, by virtue of the fact that people are bidding up its stock in the secondary market. So all secondary stock-market purchases are really just bets on the prospects of the company to earn future money, not actual capital investment.
The impact of the failure to save
Real wealth comes from actual production. Somebody, somewhere, has to turn sand into a silicon wafer, and somebody else has to turn that into a semiconductor chip, which somebody else has to turn into a computer. That's creating value. Along the way, it is vital that the property, plant, and equipment of these manufacturers be refurbished and replaced as necessary. Unless we want to fund these investments from a steadily rising mountain of debt that will someday collapse on itself, the borrowings must come from savings.
When I look around, I see nation that has failed both to save and to properly maintain its core capital stock. The bridges in my town are all "D"-rated or lower, many towns still subsist on dial-up Internet access, and practically every public building is due for a retrofit. These are local anecdotes, so take them with a grain of salt, but that's what I see.
On a larger scale, it is certain that consuming more than one produces and failing to save (two sides of the same coin) are a sure path to the poorhouse. Since the late 1970s or early 1980s, the US has been living well beyond its means, consuming more than it produces. We call this "the trade deficit," which is simply the measure of what we export against what we import. Specifically, imports are subtracted from exports, and a negative number means, "You're consuming more than you produce!"
This next chart of the trade deficit is a bit old (it comes from a seminar I gave in 2007), and I certainly should update it, but it would tell the very same story: The US is on an aggressive path to the poorhouse. To fund all that excess consumption, the US made the strategy-poor decision to borrow the difference from foreigners, a decision which will either destroy the dollar at some point in the future or cede a form of economic veto power to our future competitors.
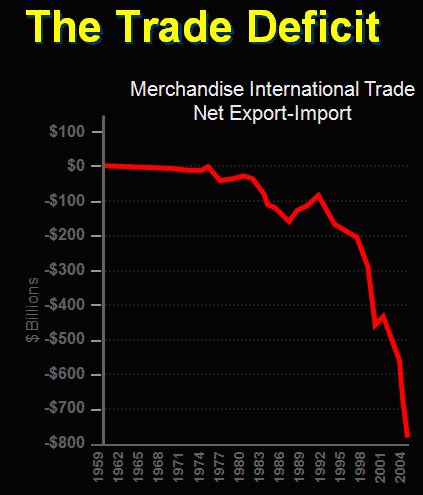
Along with this foreign borrowing came the migration of our actual sources of wealth generation (production) to offshore locations, which, when you think about it, was a necessary condition, because we were not saving enough to fund the required investments here at home anyway.
The bottom line of this story is that debt represents a claim on the future, and future cash flows cannot forever be borrowed. Eventually they must reflect actual production. That is, future wealth generation must be of sufficient size to support future debt servicing costs.
Because the US made the extremely odd conjoined decision to both fund its excess consumption with foreign borrowing and send a large proportion of its wealth generation offshore, a future consisting of a vastly diminished standard of living is about as much of a sure thing as one can find.
Frankly, I do not see any possible way for the debt promises (see the Debt-to-GDP chart) to be kept. I see a future of paper asset destruction that will bring future promises and future production back in line. I don't know all the wrinkles and details, but I am thinking that the next ten years will see the US's debt obligations shrink back to something less than 200% of GDP. Along with that, the portion of our GDP that was false, because it was inflated by excess deficit spending, will be shrinking. I think that $25 to $30 trillion of (current value) debt destruction lies along that path.
The stimulus package, as large as it is, is merely a down payment.
This means that you might need to completely rethink your views on "investing" and how assets behave, along with how you will secure and protect your wealth.
The notion that everyone can "become wealthy" through entirely passive investments in stocks and bonds is a deep-seated cultural belief that is constantly reinforced by a self-interested financial services industry. But we each might benefit by asking ourselves, "Does this makes sense?" And, if it does not, we must then ask, "What might the implications be?" Whatever answers might develop in your mind, I invite you to trust yourself and to research the matter further if you are not entirely comfortable with them.
What next?
My purpose in writing about the true source of material wealth and the impact of baby boomers on stocks, bonds, and housing prices is to prompt you to seriously consider the possibility that the economic activity of the last few decades is misleading.
It is this disconnect between "how things were" and "how things actually work" that led me to make serious changes to my life. It formed the basis for my deeply held belief that the next twenty years are going to be completely unlike the last twenty years.
If you are like me, your beliefs about "how things work" were shaped during an anomalous period which will not soon be replicated in our lifetimes - if ever. It comprised a unique combination of demographics, geopolitical circumstances, a politicized Federal Reserve, supportive energy supplies, and corporatized media better suited to reinforcing consumer beliefs than delivering essential context.
In my estimation, this marks the beginning of a great leveling of expectations between what we promised ourselves and what reality can deliver. We are in the opening stages of a grand play with many acts and even more plot twists.
I intend this piece to give you one more tool in your toolbox that you could use in your discussions with your financial advisor, spouse, friends, or with whomever you regularly discuss our future financial prospects.
The final act in this play, I suspect, will be the destruction of the dollar, along with many other fiat currencies, as stores of wealth. You still have time to begin maneuvering your wealth out of fiat (paper) currencies and into tangible expressions of wealth, but in my experience, most people won't, until and unless their beliefs are in alignment with the necessary actions. For most people, most especially me, sawing at the rope that anchors our beliefs in the past is a slow process, with progress being measured by the breaking of each individual strand.
Conclusion
Most people cannot imagine a future any different from the present. For many people, the coming changes will bring unexpected shock, inconvenience, trauma, or worse. By thinking about these possibilities now and reshaping your expectations of the future, you will be far better prepared for the ride. Some people are already experiencing unexpected and perhaps unwelcome challenges in their lives due to the economic transition that is already beginning to play out. At this point, not many are expecting change to be imposed upon them, and even fewer have thought about where this change will carry them. But some have thought about it, and making even simple changes to how you think about the future can be...well, a sound investment.
You can find the original article, the Crash Course, and much more, at my website http://chrismartenson.com
By Dr. Chris Martenson
http://chrismartenson.com/
Copyright © 2009 Dr Chris Martenson
Dr Martenson is the creator of The End of Money economic seminar series, has extensive experience analyzing and communicating financial information. Dr. Martenson combines a scientist's attention to fact and analysis (PhD, Duke University, Pathology and Toxicology) with a solid understanding of finance and economics (MBA, Cornell, Finance) with strategic thinking (4 years as a management consultant) to produce an insightful and powerful lecture. He is currently devoted to researching, writing and presenting economic and financial analyses delivering his message via his website, lecture series and is currently working on a related book & movie.
Dr. Chris Martenson Archive |
© 2005-2022 http://www.MarketOracle.co.uk - The Market Oracle is a FREE Daily Financial Markets Analysis & Forecasting online publication.


