


VIX Breakdown Forecasts Stocks Bear Panic
Stock-Markets / Stock Index Trading Apr 12, 2009 - 07:02 AM GMTBy: Steven_Vincent

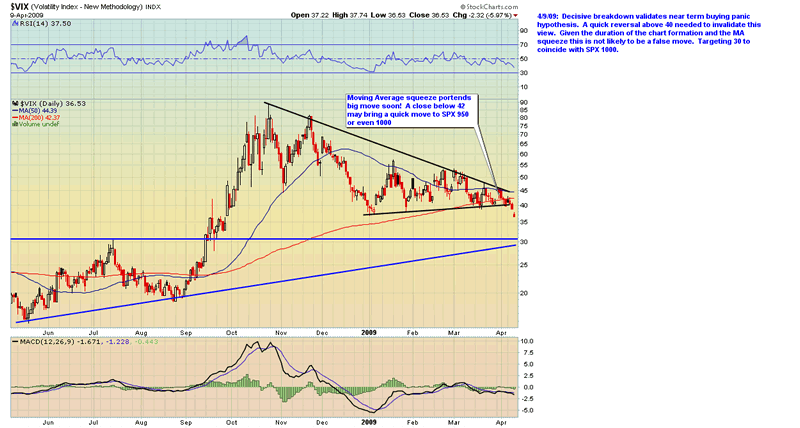
 VIX: Decisive breakdown validates near term buying panic hypothesis. A quick reversal above 40 needed to invalidate this view. Given the duration of the chart formation and the MA squeeze this is not likely to be a false move. Targeting 30 to coincide with SPX 1000.
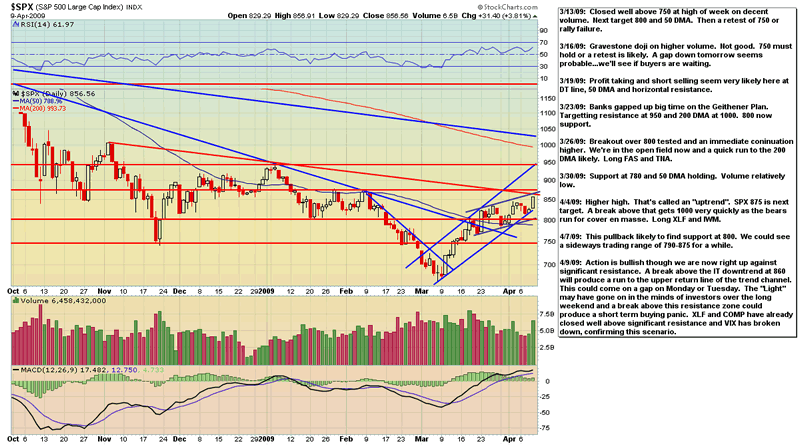
SPX: Action is bullish though we are now right up against significant resistance. A break above the IT downtrend at 860 will produce a run to the upper return line of the trend channel. This could come on a gap on Monday or Tuesday. The "Light" may have gone on in the minds of investors over the long weekend and a break above this resistance zone could produce a short term buying panic. XLF and COMP have already closed well above significant resistance and VIX has broken down, confirming this scenario.
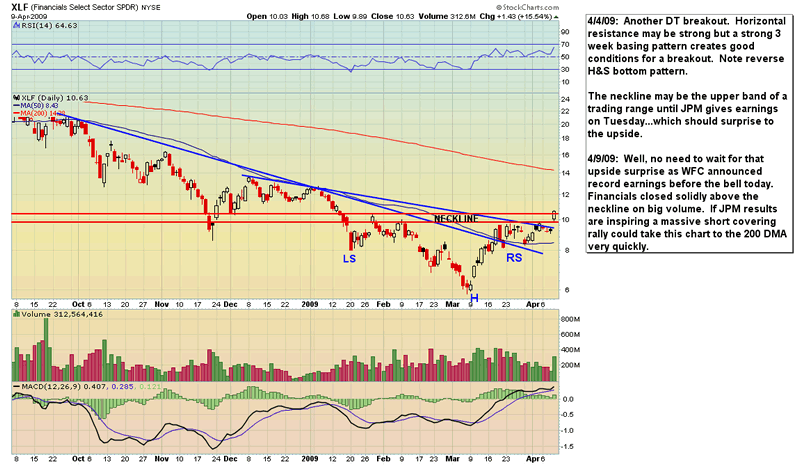
XLF: WFC announced record earnings before the bell today. Financials closed solidly above the neckline on big volume. If JPM results are inspiring a massive short covering rally could take this chart to the 200 DMA very quickly.
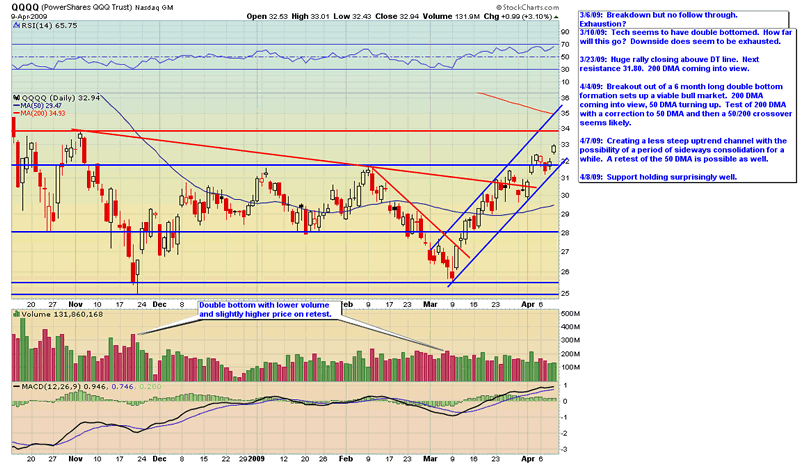
QQQQ: Technology stocks have outperformed and are now positive for the year and above intermediate term resistance. The QQQQ is now targeting its upper return line.
Market Outlook The setup is for an explosive move to 950 on the SPX as the recent rally has been met with skepticism and continued attempts to lay on short positions. Recently dips have been bought lustily and pullbacks have been shallow and brief. Risks are skewed to the upside and the risk/reward on short plays if far outweighed by the risk/reward on long positions. There may be a "recognition point" this week as bears realize they are on the wrong side of the market and sideline bulls jump on board fearing to miss out of a new bull market.
I think this action will propel the SPX all the way to 1000 where there is a cluster of significant resistance. From there I would anticipate a consolidation in a range between 1000 and 900 as the 50 DMA moves up to meet the 200 DMA. Eventually there will be a MA squeeze and the break from that narrowing range will determine the future of the market for a significant period of time. I do not have any idea about the direction of that break.
At this time there is one and only one "fundamental" that matters: liquidity. We are at an historically oversold level as an equally historical tidal wave of monetary and fiscal stimulus is hitting the shores of the financial world. The ongoing fears of economic catastrophe provides the classic "Wall of Worry" that a bull market climbs to higher highs.
I know a man who just sold his business for $50 million. When asked if he was investing the proceeds in the stock market his response was wary and cautious. He's still sitting on this capital...but for how much longer?
I am not a bull. However I am bullish at the moment in light of this technical and sentiment setup. After this setup resolves itself, it's literally anyone's guess as to what happens next.
Long TNA, long FAS. Stops at XLF 9.50, IWM 44.50, SPX 830
By Steven Vincent
“End the Fed! Sound Money for America”
Follow my charts here: http://stockcharts.com/def/servlet/Favorites.CServlet?obj=ID3279450
© 2009 Copyright Steven Vincent - All Rights Reserved
Disclaimer: The above is a matter of opinion provided for general information purposes only and is not intended as investment advice. Information and analysis above are derived from sources and utilising methods believed to be reliable, but we cannot accept responsibility for any losses you may incur as a result of this analysis. Individuals should consult with their personal financial advisors.
© 2005-2022 http://www.MarketOracle.co.uk - The Market Oracle is a FREE Daily Financial Markets Analysis & Forecasting online publication.