The Rest of the World is going to Rejuvenate the US Economy?
Economics / UK Economy May 14, 2007 - 09:07 PM GMTBy: Paul_L_Kasriel
 The “core” U.S. economy is doing fine. That is, if you exclude consumer spending, business capital goods spending and housing – almost 85% of U.S. real GDP – the outlook is rosy inasmuch as exports will surely surge because of the strong economic growth in the rest of the world. Other than the fact that exports are only about 11-1/2% of real GDP, a record high, there are other problems with depending on the rest of the world to be America's economic locomotive.
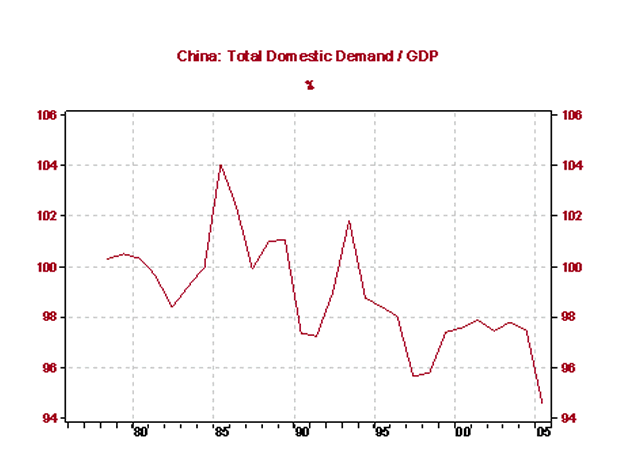
For starters, a lot of the economic growth in the rest of the world is being generated by the rest of the world's exports . Charts 1, 2 and 3 show the recent behavior of domestic demand relative to GDP for the economies of the European Union, Japan and China. As can be seen, domestic demand is flagging relative to total GDP, implying that exports are the marginal factor of strength in the rest of the world's economic growth. U.S. consumer spending amounts to 29% of the rest of the world's GDP. With U.S. households and businesses starting to slow their spending, the export sectors of the rest of the world will slow. In other words, U.S. domestic demand in recent years has been the economic locomotive for the rest of the world. Now that the locomotive is stalling, is the caboose going to cause the locomotive to re-accelerate?
Chart 1
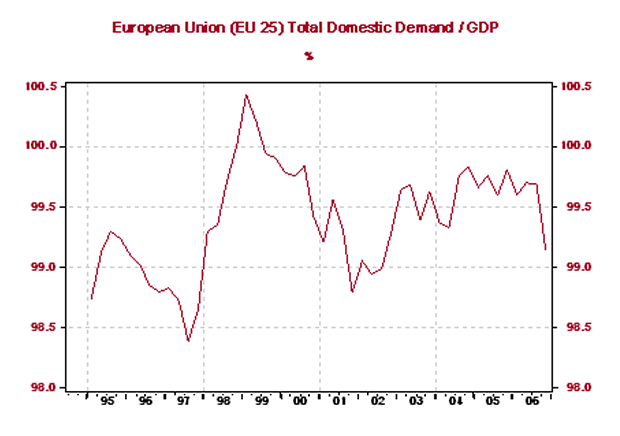
Chart 2
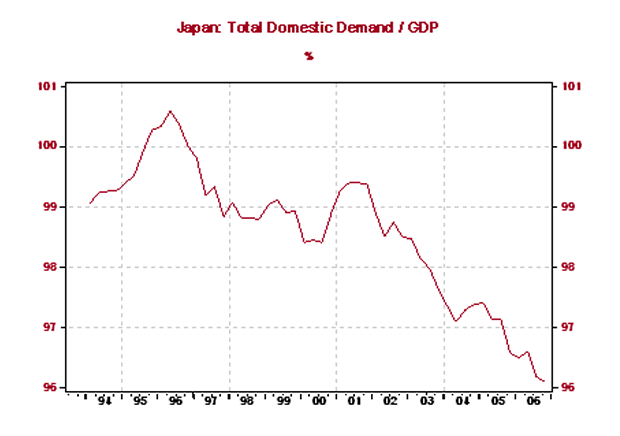
Chart 3
By the way, the engineers on the caboose are now applying the brakes. In case you missed it, the Bank of England raised its monetary policy interest rate last week, the European Central Bank will raise its policy rate next month, the Bank of Japan has hinted that it will raise its policy rate again in the not-too-distant future and the People's Bank of China has been busy raising the reserve requirements of its constituent banks. So, about the time that the rest of the world's exports start to feel the negative effects of the slowdown in U.S. consumer and business spending, the rest of the world's domestic demand will also feel the negative effects of central bank tightening.
As if the Commerce Department's first guess at first-quarter annualized real GDP growth of 1.3% were not disheartening enough, its second guess is likely to be even more disheartening. With the release of March data for our trade deficit and business inventories, it now looks as though first-quarter real GDP growth will be revised down to about 0.8% – that's annualized . Now some Pollyannas out there are saying that because part of the expected downward revision to first-quarter GDP is due to lower inventories, the stage is set for a second-quarter production snapback. Dream on. The downward revision to inventories was in the retail sector. Real retail sales fell in both March and April. So, with households finally cutting back on their spending, are merchants going to be in a hurry to restock their shelves?
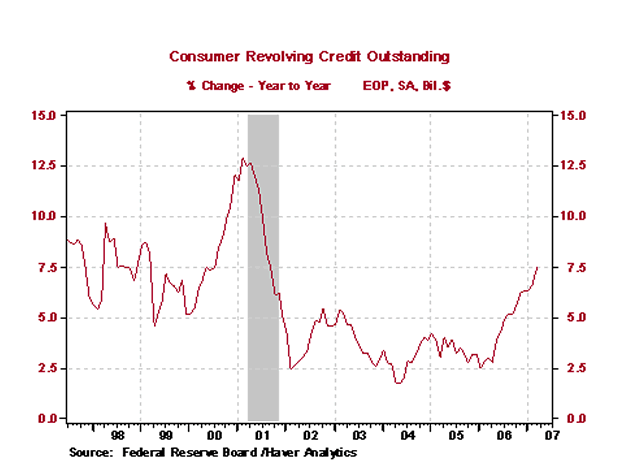
Speaking of households, even though they are cutting back on their real spending, they seem to be tapping their credit cards more now that their home ATMs are draining – i.e., home equity growth is slowing – and mortgage lenders are requiring more than a pulse to qualify for a loan. Chart 4 speaks to this point. Is this an act of desperation?
Chart 4
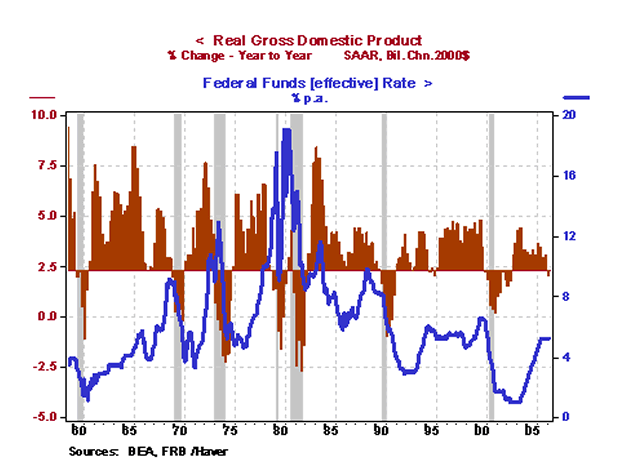
The May Blue Chip Economic Forecasters Survey consensus has real GDP growing at 2.3% in 2007 on a Q4/Q4 basis. (We submitted a forecast of 1.9% growth.) Historically, how has the Fed reacted to several quarters of real GDP growth of 2.3% or lower? Chart 5 holds the answer. In Chart 5 the bars below the horizontal line represent year-over-year real GDP growth less than 2.3%. The shaded areas represent periods of recession. Chart 5 shows that every time real GDP growth has slowed close to 2.3% or below, the Fed has allowed the federal funds rate to decline.
To be sure, most of the time real GDP growth has slowed to 2.3%, it has gone on to actually contract – i.e., a recession has occurred. But not always. In the second and fourth quarters of 1995 real GDP growth slipped below 2.3%, the Fed cut the federal funds rate and the economy did not enter a recession. In 1967, real GDP growth approached 2.3%, the Fed cut the federal funds rate and the economy avoided a recession. Of course in 1998 the Fed cut the federal funds rate with real GDP growth well above 2.3% out of fear that Long Term Capital Management's liquidity problems might become systemic. So, if history is any guide, the Fed will start cutting the federal funds rate later this year.
Chart 5
But you certainly don't get the impression the Federal Open Market Committee (FOMC), the policy arm of the Fed, is contemplating an interest rate cut. At its past two meetings, the FOMC has said that inflation remains its “predominant policy concern.” If a central bank is predominantly concerned about inflation, it does not cut interest rates. But the FOMC has been known to change its mind quickly. For example, in March 1995 the FOMC was on hold, but had a bias toward raising the federal funds rate. The next time it met, the FOMC became agnostic with regard to the likely direction of its next fed funds rate move. Then in early July 1995, the FOMC cut the funds rate by 25 basis points. In November 2000, the FOMC was still biased toward a funds rate hike. In December, it was biased toward cutting the funds rate. And on January 3, 2001, in an unscheduled telephone meeting, the FOMC cut the fed funds rate by 50 basis points. Now, of course, this is a different FOMC and every business cycle is different.
So, this FOMC may decide for various reasons that the U.S. economy needs a “cleansing” recession later this year or early next. If the FOMC does not cut the funds rate early in the second half, we think it will get a recession. But our base case is that a combination of weak real economic growth, a rising unemployment rate and moderating core inflation will move the FOMC to begin cutting the fed funds rate at its August 7 th meeting and, with much luck, the economy might avoid a recession later this year or early next a la 1995.
*Paul Kasriel is the recipient of the 2006 Lawrence R. Klein Award for Blue Chip Forecasting Accuracy
SELECTED BUSINESS INDICATORS
Table 1 US GDP, Inflation, and Unemployment Rate
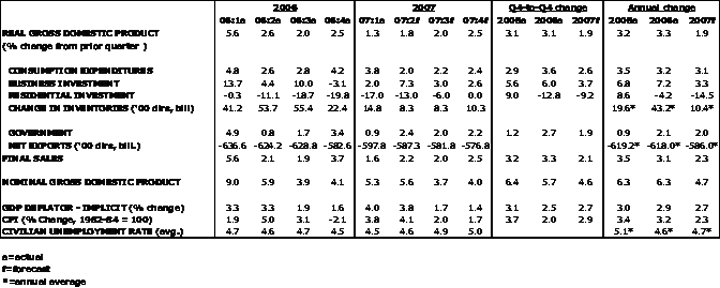
Table 2 Outlook for Interest Rates

By Paul L. Kasriel
The Northern Trust Company
Economic Research Department - Daily Global Commentary
Copyright © 2007 Paul Kasriel
Paul joined the economic research unit of The Northern Trust Company in 1986 as Vice President and Economist, being named Senior Vice President and Director of Economic Research in 2000. His economic and interest rate forecasts are used both internally and by clients. The accuracy of the Economic Research Department's forecasts has consistently been highly-ranked in the Blue Chip survey of about 50 forecasters over the years. To that point, Paul received the prestigious 2006 Lawrence R. Klein Award for having the most accurate economic forecast among the Blue Chip survey participants for the years 2002 through 2005.
The opinions expressed herein are those of the author and do not necessarily represent the views of The Northern Trust Company. The Northern Trust Company does not warrant the accuracy or completeness of information contained herein, such information is subject to change and is not intended to influence your investment decisions.
© 2005-2022 http://www.MarketOracle.co.uk - The Market Oracle is a FREE Daily Financial Markets Analysis & Forecasting online publication.


