


Close Look at the Accelerating Rate of U.S. Unemployment
Economics / Recession 2008 - 2010 Apr 08, 2009 - 08:32 PM GMTBy: Mike_Shedlock

 The trend in unemployment is unmistakably up and accelerating. Let's start with a discussion of widely followed data followed by many additional charts that you may not have seen before.
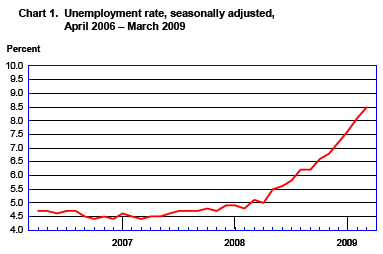
Here is a closeup from Jobs Contract 15th Straight Month; Unemployment Rate Soars to 8.5% courtesy of the BLS.
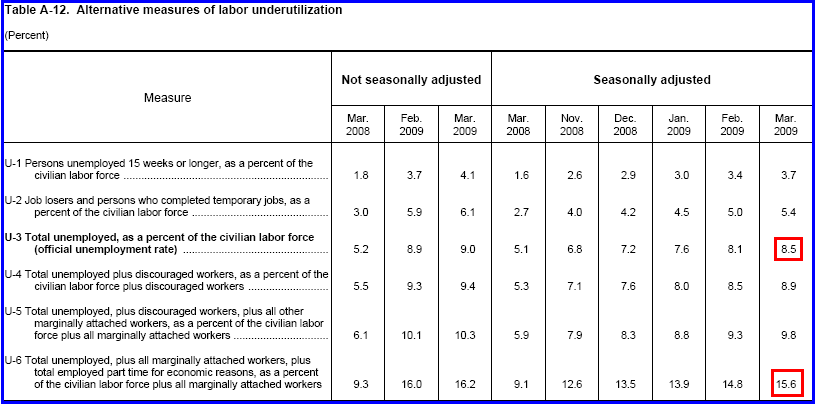
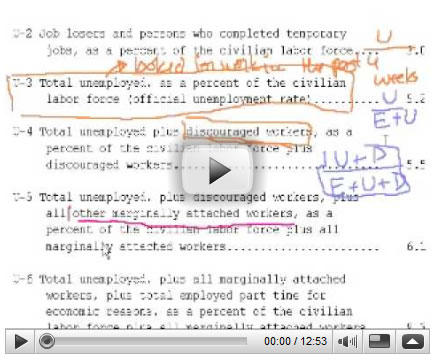
The official unemployment number is known as U-3. It does not count discouraged workers, marginally attached workers, or those working part time for economic reasons. The BLS highlights those other numbers in Table A-12.
Table A-12
Table A-12 is where one can find a better approximation of what the unemployment rate really is. Let's take a look
Grim Statistics
The official unemployment rate is 8.5% and rising sharply. However, if you start counting all the people that want a job but gave up, all the people with part-time jobs that want a full-time job, all the people who dropped off the unemployment rolls because their unemployment benefits ran out, etc., you get a closer picture of what the unemployment rate is. That number is in the last row labeled U-6.
U-6 Minus U-3 Accelerating
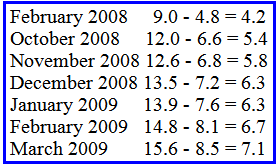
The above table shows that U-6 is accelerating faster than U-3. This is important because U-6 is a far better approximation of unemployment than U-3 (the "official" number).
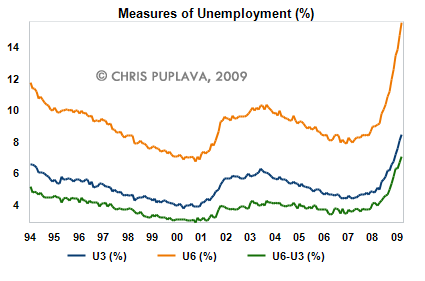
I asked my friend Chris Puplava at Financial Sense if he could produce historical charts of the above trend. Chris was happy to oblige. He even added some additional charts to discuss as well.
U-6 Vs. U-3 Historical
U-6, U-3 and Median Weeks Unemployed
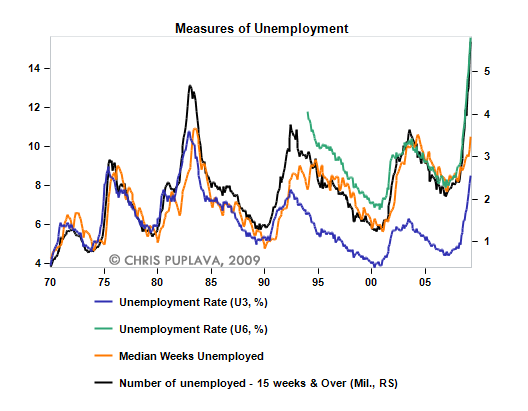
Note that U-6 is an artifact of the Clinton administration. It did not exist prior to 1994.
To make the unemployment statistics look better, Clinton decided to ignore certain classes of workers such as those who want work but did not look in the last 4 weeks. Thus, It makes no sense to compare the reported unemployment of today to historical numbers.
Using U-6 as our measure, unemployment easily exceeds the unemployment rate in the 70, 8o's and early Clinton years as well.
Part Time Workers as a Percentage of Total Employment
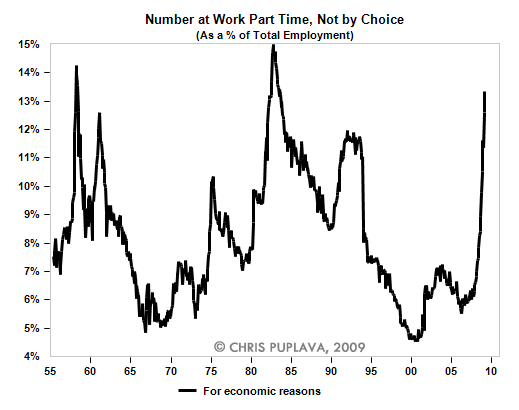
Part time unemployment for economic reasons is soaring. One person emailed me last week saying his hours were cut from 20 to 4. That person is still considered employed.
Salman Khan on Unemployment
Consumer Sentiment vs. Unemployment
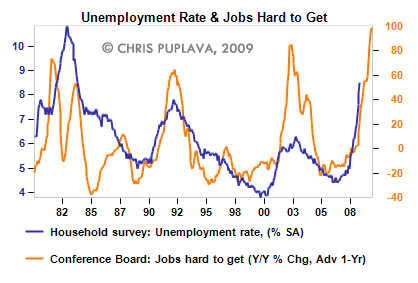
The above chart shows U-3 unemployment vs. the consumer conference board survey of how hard it is to find jobs. The year over year survey results suggests consumers believe jobs are increasingly hard to get.
Note that the survey is a leading or coincident indicator while unemployment itself is a lagging indicator. This portends more job weakness for quite some time even after the peak in "hard to find" sentiment is reached.
Unemployment (U-6) is well on its way to 20%. These are depression conditions. For more on a comparison between unemployment today and that during the Great Depression, please see Census Hiring To Create 1.4 Million Jobs , and scroll down to the section called Depression Statistics .
By Mike "Mish" Shedlock
http://globaleconomicanalysis.blogspot.com
Click Here To Scroll Thru My Recent Post List
Mike Shedlock / Mish is a registered investment advisor representative for SitkaPacific Capital Management . Sitka Pacific is an asset management firm whose goal is strong performance and low volatility, regardless of market direction.
Visit Sitka Pacific's Account Management Page to learn more about wealth management and capital preservation strategies of Sitka Pacific.
I do weekly podcasts every Thursday on HoweStreet and a brief 7 minute segment on Saturday on CKNW AM 980 in Vancouver.
When not writing about stocks or the economy I spends a great deal of time on photography and in the garden. I have over 80 magazine and book cover credits. Some of my Wisconsin and gardening images can be seen at MichaelShedlock.com .
© 2009 Mike Shedlock, All Rights Reserved
Mike Shedlock Archive |
© 2005-2022 http://www.MarketOracle.co.uk - The Market Oracle is a FREE Daily Financial Markets Analysis & Forecasting online publication.