How FAS 157 Mark-to-Market Helped Slow the Economy
Stock-Markets / Credit Crisis 2009 Apr 06, 2009 - 11:05 AM GMTBy: Frank_Holmes

 There's been a lot of discussion of how the FAS 157 mark-to-market accounting rule may have contributed to the current deep recession. The charts below from Citi Research (using Federal Reserve data) make a pretty compelling case for the unforeseen damage caused by the strict application of FAS 157. We are among those who applaud the Financial Accounting Standards Board for taking action this week to add flexibility in how the mark-to-market rule is used going forward.
I want to walk you through the harsh impact of FAS 157, but first it's important that you understand a little about bank capital requirements.
Under federal law, banks are required to have a certain amount of equity on their balance sheets and a sound bank must have a leverage ratio of no less than 4 percent – simply speaking, they must have at least $4 in equity for every $100 in assets (primarily outstanding loans). Many conservative banks have leverage ratios much greater than 4 percent.
The key point here is that if a bank's balance sheet equity declines, so does its ability to make new loans and, since lending money is central to a bank's operations, fewer loans generally translates to lower revenue and lower profits.
Across the broader economy, fewer loans means less business activity.
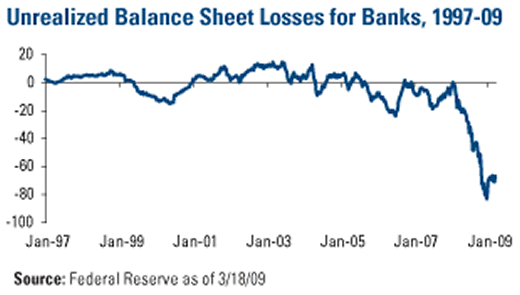
The chart below shows the change in the banking industry's unrealized equity losses on their balance sheets (classified as “other comprehensive income”, or OCI). This tends to be mostly investment gains and losses yet to be realized, and is measured here in billions of dollars.

As you can see, for most of the past 12 years the aggregate OCI for the banks fluctuated between unrealized gains of $20 billion and unrealized losses of $20 billion. Then starting in the first quarter of 2008, OCI plunged from essentially flat in late January to losses totaling nearly $80 billion by the end of the year.
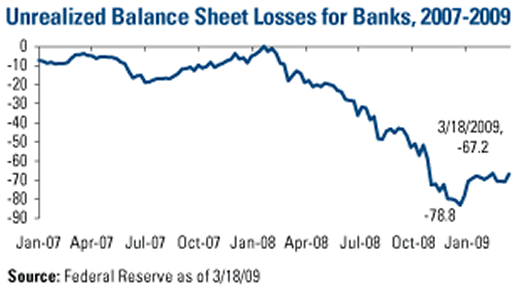
The chart below provides a closer look at OCI over the time period beginning in January 2007. The first year was consistent with the longer-term trend depicted on the chart above, but that changed abruptly and dramatically in 2008.

The beginning of 2008 was when the financial companies were first required to use FAS 157 to value securities on their balance sheets. Many of these securities were not trading during this time due to impaired markets, prompting banks to take large writedowns to comply with the prevailing interpretations of FAS 157. Those writedowns continued each quarter in 2008, with the steepest decline coming late in the year.
The news has been somewhat better in 2009, with aggregate OCI climbing up to a negative $67.2 billion as of mid-March.
Why is this important? The $67 billion in OCI losses since January 2008 is another way of saying that the banks have lost $67 billion in equity.
Using the maximum 4 percent leverage ratio between bank equity and loans, this means that the banks have been eligible to lend roughly $1.6 trillion less than they could have had they not been obligated to make these FAS 157-related quarterly writedowns. Even applying a conservative 10 percent leverage ratio, the foregone loans add up to nearly $700 billion.
The banks could in theory have raised more equity to expand their loan portfolios, but this avenue was largely closed to them because their shares were being hammered by short sellers who understood that FAS 157 would lead to more writedowns.
As we have said, FAS 157 was implemented with the best of intentions, and by no means was that rule change the sole cause of weakened balance sheets. But it's become clear there were unforeseen complications in the application of FAS 157 that have proven detrimental to financial companies.
These charts provide compelling visual evidence of the magnitude of that impact, and the considerable benefits of a more flexible FAS 157.
The fastest route to shrinking loans was to tell hedge funds to sell the stocks, bonds and commodities, and this triggered the global liquidation of all asset classes. This was forced panic selling. It is estimated that hedge funds were forced to liquidate more than $1 trillion in assets. Hopefully the worst is behind us now.
By Frank Holmes, CEO , U.S. Global Investors
Frank Holmes is CEO and chief investment officer at U.S. Global Investors , a Texas-based investment adviser that specializes in natural resources, emerging markets and global infrastructure. The company's 13 mutual funds include the Global Resources Fund (PSPFX) , Gold and Precious Metals Fund (USERX) and Global MegaTrends Fund (MEGAX) .
More timely commentary from Frank Holmes is available in his investment blog, “Frank Talk”: www.usfunds.com/franktalk .
Please consider carefully the fund's investment objectives, risks, charges and expenses. For this and other important information, obtain a fund prospectus by visiting www.usfunds.com or by calling 1-800-US-FUNDS (1-800-873-8637). Read it carefully before investing. Distributed by U.S. Global Brokerage, Inc.
All opinions expressed and data provided are subject to change without notice. Some of these opinions may not be appropriate to every investor. Gold funds may be susceptible to adverse economic, political or regulatory developments due to concentrating in a single theme. The price of gold is subject to substantial price fluctuations over short periods of time and may be affected by unpredicted international monetary and political policies. We suggest investing no more than 5% to 10% of your portfolio in gold or gold stocks. The following securities mentioned in the article were held by one or more of U.S. Global Investors family of funds as of 12-31-07 : streetTRACKS Gold Trust.
Frank Holmes Archive |
© 2005-2022 http://www.MarketOracle.co.uk - The Market Oracle is a FREE Daily Financial Markets Analysis & Forecasting online publication.


