


Stock Market Counter Trend Rally Could Extend for Several Months
Stock-Markets / Stock Index Trading Apr 06, 2009 - 01:33 AM GMTBy: Andre_Gratian

 Current Position of the Market
SPX: Long-term trend -
Down! The very-long-term cycles have taken over and if they make their lows when expected, the bear market which started in October 2007 should continue until 2012-2014. This would imply that much lower prices lie ahead.
SPX: Intermediate trend - The index may have started a counter-trend rally which has the potential of extending itself in a bumpy ride for several months if it can overcome the resistance which lies directly overhead. There are important cycles bottoming in early May which will affect the market short-term.
Analysis of the short-term trend is done on a daily basis with the help of hourly charts. It is an important adjunct to the analysis of daily and weekly charts which determines the course of longer market trends.
Daily market analysis of the short term trend is reserved for subscribers. If you would like to sign up for a FREE 4-week trial period of daily comments, please let me know at ajg@cybertrails.com .
Overview:
It appears that an important market low was made on March 6, 2009. During that month, equities made their best showing in quite a while, with the SPX advancing a solid 165 points and continuing to go higher in April.
In terms of Elliott Wave labeling, opinion is divided on whether 667 marked the completion of intermediate wave (3) or (5). If (5), this would have also have completed a primary wave 1, or corrective wave A from the 2007 top. We can label the pattern correctly later on. Whatever the market did, we seem to have started an important move which has the potential of lasting several weeks, or even months, but first, we will have to see the effect of a nest of important cycles due to bottom in late April and early May.
Investor mood has improved lately on signs that the economy is beginning to stabilize, and even with another bad jobs report on Friday, the market managed to shrug off the news and close with a gain. Considering that the indices are short-term overbought and facing tremendous overhead resistance in the form of a multitude of important trend lines (which will be our focus in the chart analysis later on), and that it continues to move up, is a sign of strong underlying strength.
This strength will be tested in late April and early May with a nest of cycles bottoming during that time period as well as an Armstrong cycle date coming on "about" April 16 -- which could turn out to be a high with the market rising into it, instead of a low. All these cycles will make the month of April very interesting.
It's also probable that investor mood has been enhanced by the successful reception that President Obama and Michelle are enjoying overseas, but there is bound to be a reality-check after they get back and the backto- earth appreciation that major economic problems remain unsolved.
What's ahead?
Chart Pattern and Momentum
Enough time has now passed to define the major trends of the stock market. In this weekly chart, we show two main channels, one outlined in brown -- the current main bear market trend and, contained within that one, another outlined in green which represents a secondary market trend which could be a primary decline all by itself! In order for this bear market to be over, prices will have to move out of the brown channel completely! This will take some time, and will probably not happen until next year. Unfortunately, this will probably not be the end of the entire decline. This is likely to only represent an "A" leg of the total bear market, with "B" and "C" legs to come and to conclude sometime in 2012-2014. This is when the very long 120-year cycle is expected to make its low. By then, the SPX should have declined to about 350-400. So much for the "hold stocks for the long term" theory, and the economy showing signs of recovery!
On the chart, I have also labeled what I believe is the correct EW structure. Time will tell and it does not really matter at this point. Cycles and a quiver full of other methodologies will help to determine the future market course. For the time being, the oscillators are still in a strong uptrend with no bearish indications.
Moving to the daily chart, you can see that there are more than half a dozen major trend and resistance lines which are converging to just about where we are now. We will see this more clearly next, on the hourly chart. This is inducing some profit taking which is noticeable in the indicators. The middle one indicates that the index has been overbought for a while, and is approaching the edge of its channel, which is normally a sign that we should watch for a sell signal. Especially with the A/D oscillator (below) which is showing negative divergence. Prices are trading outside of their trend line and crawling along the bottom of the uptrend channel. This, too, means that they can reverse at anytime.
For a better look at the trend lines and the levels where they offer resistance, we'll turn to the hourly chart. First, an explanation of the lines. The solid green trend line at the top is the top of the inside channel. Thin green lines are parallels drawn from previous tops or bottoms. Same for the brown dashed trend lines which are parallels drawn to the main bear market channel shown on the weekly chart. Note how, on the daily chart above, one of these parallels contained prices at the 667 low. The red dashed lines are important resistance levels from the past. The up-slanting red line is and extension of the trend line across the January/February lows. And the blue solid blue trend line is across the tops of October, November, and January.
The first level of congestion is where we are now, and we are moving through it after being pushed back initially. It looks as if we are seeking to complete a small 5-wave formation from the low of Friday's opening. If this turns out to be wave one of the 5h wave from 780, we should be able to move higher after that, perhaps into the Armstrong cycle date, to complete the 5 waves and then correct into the end of the month. This is only speculation at this point, but a possible scenario. The SPX is still well within its rising channel, and unless it has a large correction right away, it is likely that it will continue a little higher.
The hourly indicators pretty much duplicate those of the daily chart. The real weakness is only reflected in the bottom one which is the breadth oscillator. Since the negative divergence pattern is fairly serious, I would not be surprised if we complete the small 5th wave first thing on Monday morning, and then back off. We will not be in a full-fledged decline until be break below 780.
There is a minor cycle due late Tuesday, which would be perfect for a pull-back. The blue MA line is the 50- hour MA, and it does a pretty good job of containing short pull-backs. That might be a good target for an initial retracement. We also have some potential Fibonacci CITs coming up this week.
Cycles
There is some disagreement about the exact day of the Armstrong cycle. It ranges somewhere between 4/16 and 4/23, so we'd better not fix on any time frame, and let the market define it.
There is a minor cycle low due either late Tuesday or early Wednesday.
A cluster of larger cycles should be making their lows beginning late April and going into early May. This calls for a low in that time frame which would be perfect for the end of the correction which is about to start.
Projections:
The current projection calls for a move to about 860 which, as you can see on the charts above, would put the SPX at the top of the green channel. Moving to this level in the next few days would position the indicators even closer to a sell signal.
This is the only projection there is to consider, right now. We are not yet ready to make a projection for the Early May low. First we need to have a short-term top in place.
Breadth
The intermediate condition of the A/D, as represented by the McClellan summation index (courtesy of StockCharts) continues to improve. The positive divergence to the market at the March low proved to be important, especially when it was supported by the new highs/new lows index with similar divergence. The McClellan index appears to be getting back into a longer term uptrend, which will be confirmed if it makes a new high. This is likely since its RSI is just now reaching an overbought position which is not yet as extreme as it normally gets at a market top.
The daily indicator has corrected and is moving back up, but it is lagging the SPX and shows well-defined negative divergence. This is at odds with the SI, and could mean a small correction followed by more upside. Nevertheless, it's a red flag, and we should heed it.
The hourly A/D index will most likely show negative divergence if we go beyond 846.61 and complete that small five-wave pattern in the SPX. Another red flag for the short term!
Market Leaders and Sentiment
The sentiment indicator (courtesy of Sentimentrader) shows that we should be at a short-term top, and for the first time in several weeks, the longer term indicator has retreated to a slightly negative position.
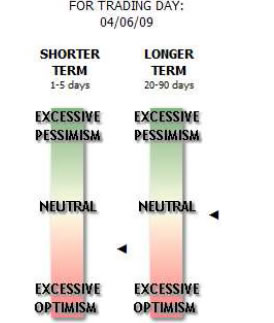
Its readings match the market indicators, both short and longer term, as well as the breadth oscillators. They all signal that we should prepare for an imminent correction of the SPX advance from 667.
However, the fact that the NDX continues to show strong upward momentum and has now broken and closed above its January highs may be telling us that 667 is probably going to remain the low of the longer term decline, even as we correct into late April/early May.
Summary
Two weeks ago, I wrote:
There are signs that SPX 667 could have been the intermediate low that we have been waiting for, and that the rally which started at that level could be the beginning of a larger move.
Confirmation would require a mild consolidation of the current advance, followed by another strong advance.
The prognosis for the future market course is pretty much the same, except that after we find our short-term high, we should get a much stronger correction into the end of the month and early May before we resume the uptrend.
The following are examples of unsolicited subscriber comments:
Awesome calls on the market lately. Thank you. D M
Your daily updates have taken my trading to the next level. D
… your service has been invaluable! It's like having a good technical analyst helping me in my trading. SH
I appreciate your spot on work more than you know! M
But don't take their word for it! Find out for yourself with a FREE 4-week trial. Send an email to ajg@cybertrails.com .
By Andre Gratian
MarketTurningPoints.com
A market advisory service should be evaluated on the basis of its forecasting accuracy and cost. At $25.00 per month, this service is probably the best all-around value. Two areas of analysis that are unmatched anywhere else -- cycles (from 2.5-wk to 18-years and longer) and accurate, coordinated Point & Figure and Fibonacci projections -- are combined with other methodologies to bring you weekly reports and frequent daily updates.
“By the Law of Periodical Repetition, everything which has happened once must happen again, and again, and again -- and not capriciously, but at regular periods, and each thing in its own period, not another’s, and each obeying its own law … The same Nature which delights in periodical repetition in the sky is the Nature which orders the affairs of the earth. Let us not underrate the value of that hint.” -- Mark Twain
You may also want to visit the Market Turning Points website to familiarize yourself with my philosophy and strategy.www.marketurningpoints.com
Disclaimer - The above comments about the financial markets are based purely on what I consider to be sound technical analysis principles uncompromised by fundamental considerations. They represent my own opinion and are not meant to be construed as trading or investment advice, but are offered as an analytical point of view which might be of interest to those who follow stock market cycles and technical analysis.
Andre Gratian Archive |
© 2005-2022 http://www.MarketOracle.co.uk - The Market Oracle is a FREE Daily Financial Markets Analysis & Forecasting online publication.