


U.S. Jobs Contract 15th Straight Month; Unemployment Rate Soars to 8.5%
Economics / Recession 2008 - 2010 Apr 03, 2009 - 12:46 PM GMTBy: Mike_Shedlock

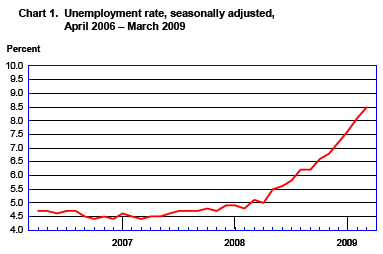
 This morning, the Bureau of Labor Statistics (BLS) released the March Employment Report . Nonfarm payroll employment continued to decline sharply in March (-663,000), and the unemployment rate rose from 8.1 to 8.5 percent, the Bureau of Labor Statistics of the U.S. Department of Labor reported today. Since the recession began in December 2007, 5.1 million jobs have been lost, with almost two-thirds (3.3 million) of the decrease occurring in the last 5 months. In March, job losses were large and widespread across the major industry sectors.
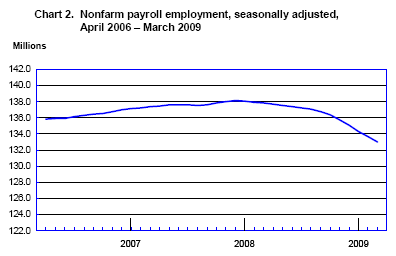
Nonfarm Payroll employment has shrunk below early 2006 levels.
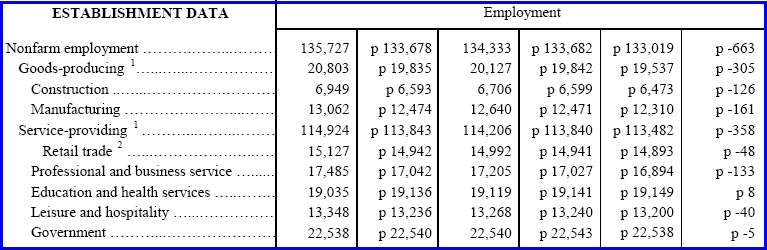
Highlights
- 663,00 jobs were lost in total
- 126,000 construction jobs were lost
- 161,000 manufacturing jobs were lost
- 358,000 service providing jobs were lost
- 48,000 retail trade jobs were lost
- 133,000 professional and business services jobs were lost
- 8,000 education and health services jobs were added
- 40,000 leisure and hospitality jobs were lost
- 5,000 government jobs were lost
It was nearly a clean sweep this month. 8,000 education and health services jobs were the only gains for march.
Note: some of the above categories overlap as shown in the preceding chart, so do not attempt to total them up.
Birth Death Model Revisions 2008
Birth Death Model Revisions 2009
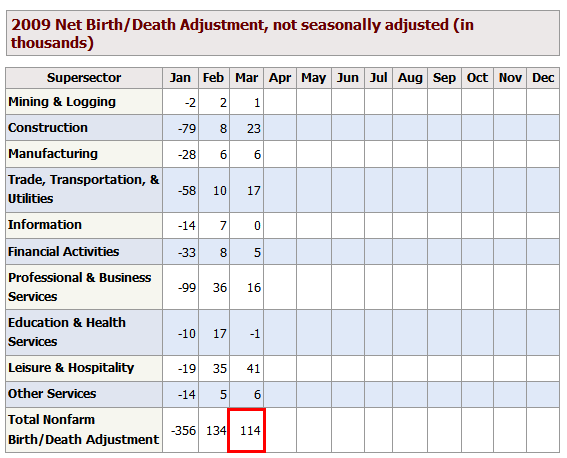
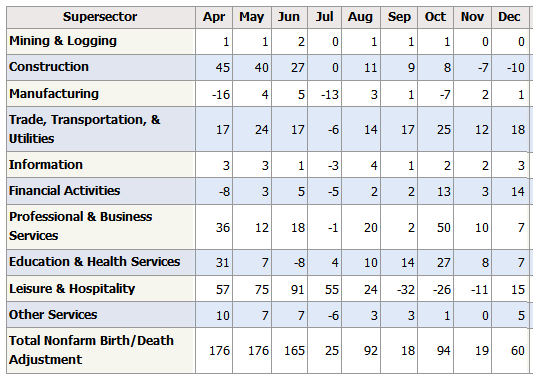
Birth/Death Model Revisions
After the typical in January in which the Birth/Death Model revisions bore some semblance of reality, the Birth/Death numbers are back in outer space.
Many small 1-5 person service providing shops in mortgage lending and real estate are throwing in the towel. Those small businesses are not properly accounted for in the Birth-Death Model. At this point in the cycle birth death numbers should be massively contracting.
Month after month, with the exception of January, the BLS is assuming more jobs were created by new businesses than lost by businesses closing shop. The BLS model is horribly wrong.
BLS Black Box
For those unfamiliar with the birth/death model, monthly jobs adjustments are made by the BLS based on economic assumptions about the birth and death of businesses (not individuals). Those assumptions are made according to estimates of where the BLS thinks we are in the economic cycle.
The BLS has admitted however, that their model will be wrong at economic turning points. And there is no doubt we are long past an economic turning point.
Here is the pertinent snip from the BLS on Birth/Death Methodology.
- The net birth/death model component figures are unique to each month and exhibit a seasonal pattern that can result in negative adjustments in some months. These models do not attempt to correct for any other potential error sources in the CES estimates such as sampling error or design limitations.
- Note that the net birth/death figures are not seasonally adjusted, and are applied to not seasonally adjusted monthly employment links to determine the final estimate.
- The most significant potential drawback to this or any model-based approach is that time series modeling assumes a predictable continuation of historical patterns and relationships and therefore is likely to have some difficulty producing reliable estimates at economic turning points or during periods when there are sudden changes in trend.
Household Data
In March, the number of persons working part time for economic reasons (sometimes referred to as involuntary part-time workers) climbed by 423,000 to 9.0 million. This category includes persons who would like to work full time but were working part time because their hours had been cut back or because they were unable to find full-time jobs.
Persons Not in the Labor Force
About 2.1 million persons (not seasonally adjusted) were marginally attached to the labor force in March, 754,000 more than a year earlier. These individuals wanted and were available for work and had looked for a job sometime in the prior 12 months. They were not counted as unemployed because they had not searched for work in the 4 weeks preceding the survey.
Among the marginally attached, there were 685,000 discouraged workers in March, up by 284,000 from a year earlier. Discouraged workers are persons not currently looking for work because they believe no jobs are available for them. The
other 1.4 million persons marginally attached to the labor force in March had not searched for work in the 4 weeks preceding the survey for reasons such as school attendance or family responsibilities.
Table A-5 Part Time Status
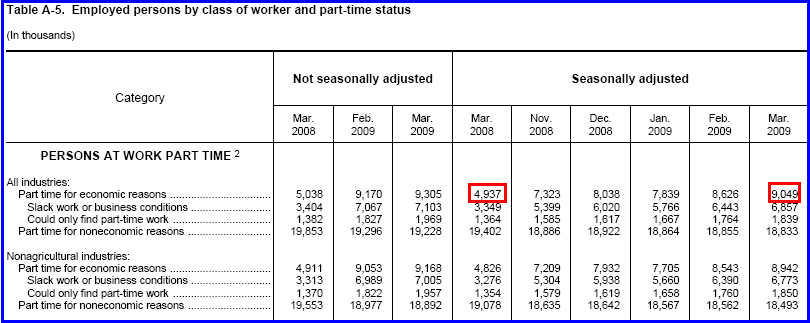
The chart shows 9 million people are working part time but want a full time job. A year ago the number was 4.9 million.
Table A-12
Table A-12 is where one can find a better approximation of what the unemployment rate really is. Let's take a look
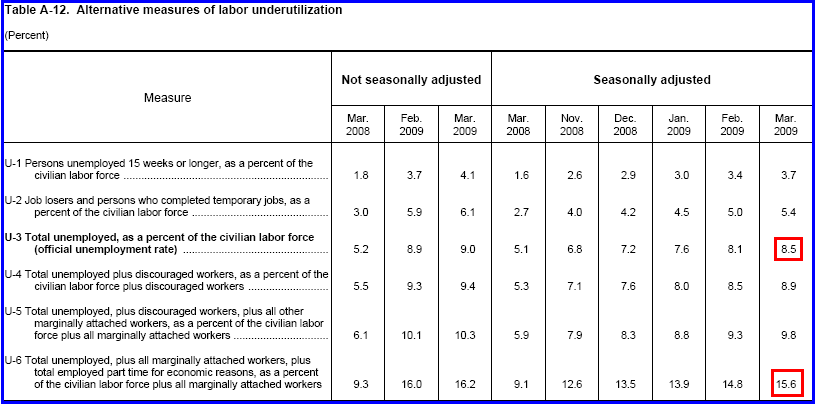
Grim Statistics
The official unemployment rate is 8.5% and rising sharply. However, if you start counting all the people that want a job but gave up, all the people with part-time jobs that want a full-time job, all the people who dropped off the unemployment rolls because their unemployment benefits ran out, etc., you get a closer picture of what the unemployment rate is. That number is in the last row labeled U-6.
It reflects how unemployment feels to the average Joe on the street. U-6 is 15.6%. Both U-6 and U-3 (the so called "official" unemployment number) are poised to rise further.
Looking ahead, I expect the service sector to continue to weaken. Mall vacancy rates are rising and a huge contraction in commercial real estate is finally started. There is no driver for jobs and states in forced cutback mode are making matters far worse.
Unemployment is a lagging indicator, it is likely to continue rising until sometime in 2010.
ADP Employment Report
For another look at March jobs including a breakdown of stats by small, medium, and large sized businesses, please take a look at ADP Reports March Nonfarm Private Employment Decreased 742,000 .
Depression Level Statistics
I consider these job losses to be depression level totals. Admittedly conditions are not as bad as the great depression, but this is certainly no ordinary recession by any economic measure including lending, housing, bank failures, jobs, the stock market, commodity prices, treasury yields etc. For more on this idea please see Humpty Dumpty On Inflation .
By Mike "Mish" Shedlock
http://globaleconomicanalysis.blogspot.com
Click Here To Scroll Thru My Recent Post List
Mike Shedlock / Mish is a registered investment advisor representative for SitkaPacific Capital Management . Sitka Pacific is an asset management firm whose goal is strong performance and low volatility, regardless of market direction.
Visit Sitka Pacific's Account Management Page to learn more about wealth management and capital preservation strategies of Sitka Pacific.
I do weekly podcasts every Thursday on HoweStreet and a brief 7 minute segment on Saturday on CKNW AM 980 in Vancouver.
When not writing about stocks or the economy I spends a great deal of time on photography and in the garden. I have over 80 magazine and book cover credits. Some of my Wisconsin and gardening images can be seen at MichaelShedlock.com .
© 2009 Mike Shedlock, All Rights Reserved
Mike Shedlock Archive |
© 2005-2022 http://www.MarketOracle.co.uk - The Market Oracle is a FREE Daily Financial Markets Analysis & Forecasting online publication.