


Gold and Silver- To buy or not to buy – That is the question
Commodities / Gold & Silver 2009 Apr 03, 2009 - 09:55 AM GMTBy: Peter_Degraaf

 Historically, and based on 35 years of data, gold usually puts in a bottom in March and a top in April. We've had the bottom in March (on March 18 th ), and we await a top in April.
This top in April usually lasts for several months, resulting in sideways action with a downward bias and another buying opportunity in June or July.
The next question is: Can we count on gold rising to a top in April, or is this a year where we cannot count on historical data?
(In the case of silver we most often see a top in May followed by seasonal weakness).
For the answers to our questions we turn to the charts.
Charts courtesy www.stockcharts.com and Federal Reserve Bank of St. Louis .
Featured is the weekly gold chart. The blue arrows point to the bottoming of the 7 – 8 week gold cycle. The last bottom came in week #9 and we are currently operating in week #2. Price on Thursday morning is testing the multi-month support line. It is at this juncture that people either step in and buy, or panic and sell out. As long as the fundamentals are bullish for gold (and they are), then it makes more sense to buy gold here than to sell gold. The expectation is that since we are in week #3 of the 7 – 8 week cycle, gold is more likely to rise from here than to fall below the support line.
My Gold Direction Indicator is registering +72% which is a buy signal. The supporting indicators (RSI and MACD) are positive.
Featured is the index that compares the gold and silver stocks of the HUI index to the price of gold. On Wednesday April 1 st this index flashed a buy signal, as price established itself above the 200DMA. A rising trend in this index is bullish for both gold and gold and silver stocks. The supporting indicators are positive.
Featured is the SLV silver ETF. The last three times price came near the rising support line, (including so far on April 2 nd ), buyers forced the price back up again (blue arrow). Volume has been declining during the pull-back which is bullish (green arrow). The RSI is at multi-month support (horizontal green line), and the 50DMA has just moved into positive alignment with the 200DMA, which is another bullish signal.
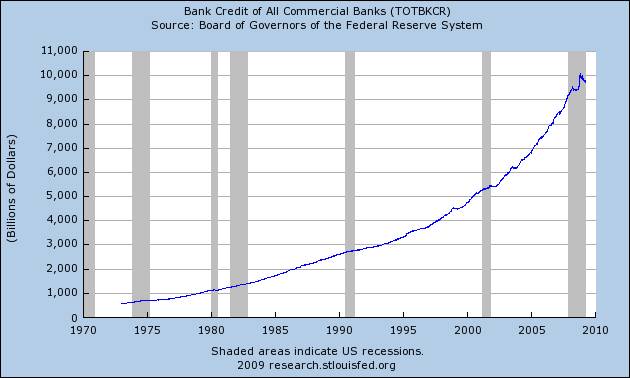
Featured is the chart that reflects the total bank credit at the US commercial banks. It reflects the loose policies of the Fed, as the trend is in the process of going exponential. The aim of the FED is obviously to push the trend higher. Notice at the top of the chart, some reluctance on the part of bank credit to keep rising. This reflects a slowdown in the increase in bank credit despite the Fed's efforts to force banks to have and make credit available to the market place. This in turn will cause the FED to pump money into the system even faster, as they do not want this trend to turn down. This chart then presents a picture that is bullish for gold and silver, as it makes a strong case for further accommodation on the part of the Fed.
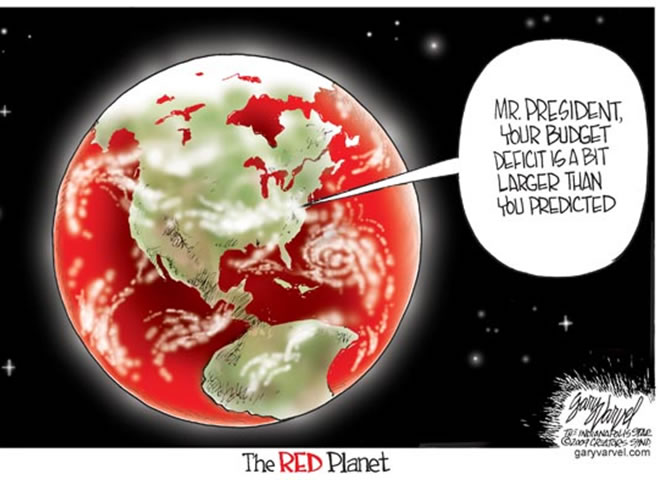
Featured is the chart that shows the current and projected US government deficits as charted by the US G.A.O.
Federal deficits always lead to monetary inflation which leads to price inflation which leads to commodity inflation (including and especially gold and silver).
Featured is the CEF, Central Fund of Canada. The uptrend is well defined. The supporting indicators are positive. Volume has been declining during the recent pull-back which is bullish. Earlier today (April 2 nd ) I added to my holdings in CEF by buying at the 50DMA (blue arrow), and I then sent out an alert to my many subscribers, so they could do the same if they so desired.
Summary: As long as the fundamentals for gold and silver are bullish (and they are – current Washington policies guarantee it), every price dip presents an opportunity to buy.
During a bull market, every time price moves near the 50DMA it is an opportunity to buy.
A popular feature on his website are the long-term charts which are updated frequently.
“He who buys the dips and rides the waves will be a winner in the end.” Richard Russell.
“Like gold, U.S. dollars have value only to the extent that they are strictly limited in supply. But the U.S. government has a technology, called a printing press (or today, it's electronic equivalent), that allows it to produce as many U.S. dollars as it wishes, at essentially no cost.
We conclude that, under a paper-money system, a determined government can always generate higher spending and hence positive inflation. (Ben Bernanke Nov 21, 2002 ).
“The national budget must be balanced. The public debt must be reduced; the arrogance of the authorities must be moderated and controlled. Payments to foreign governments must be reduced, if Rome does not want to go bankrupt. People must learn to work, instead of living on public assistance”. ( Cicero , uttered in 55 BC).
“It is well enough that people of this nation do not understand our banking and monetary system – for if they did, I believe there would be a revolution before tomorrow morning”.
Henry Ford.
(These quotes are a small part of a collection of quotes found on my website).
Happy trading!
By Peter Degraaf
Peter Degraaf is an on-line stock trader with over 50 years of investing experience. He issues a weekend report on the markets for his many subscribers. For a sample issue send him an E-mail at itiswell@cogeco.net , or visit his website at www.pdegraaf.com where you will find many long-term charts, as well as an interesting collection of Worthwhile Quotes that make for fascinating reading.
DISCLAIMER: Please do your own due diligence. I am NOT responsible for your trading decisions.
Peter Degraaf Archive |
© 2005-2022 http://www.MarketOracle.co.uk - The Market Oracle is a FREE Daily Financial Markets Analysis & Forecasting online publication.