Stocks Bear Market Targets Dow 2,122 and S&P 409
Stock-Markets / Stocks Bear Market Mar 30, 2009 - 09:36 AM GMTBy: Submissions

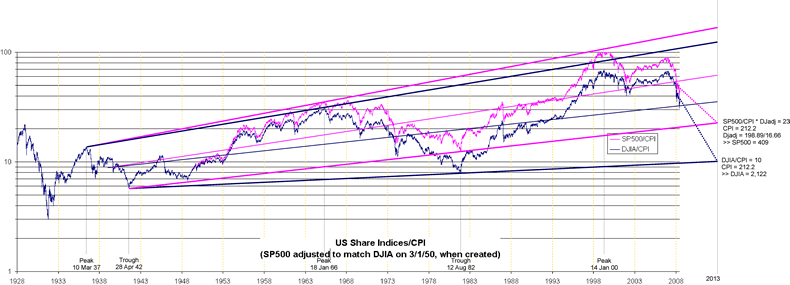
 Glenn Thorpe writes: Charts of the DJIA and the SP500 provide a much clearer picture when they are inflation adjusted. This is achieved simply by dividing the index by the CPI at each date. To correlate the two indices the SP500 can be adjusted to equal the the DJIA on 3 Jan 1950, the date the SP500 was created.

Displaying these indices on a logarithmic scale further enhances the view. It permits straight lines of high, low and mid points to be added to the chart.
A high point line drawn using the post-1929 high points of 1937 and 1966 correlates very well to the peak of 2000. For the SP500 this 2000 peak of 103.6 is about 3% from the expected value of 107. For the DJIA it is within 20%, an actual peak of 70 compared to the expected value of 83.
The most interesting point is the low point line, and the values expected when the market eventually bottoms. If the market bottoms in 2013 the expected lows are 409 for the SP500 and 2,122 for the DJIA. If the market does not bottom for another 15 years, which is what happened between 1966 and 1982, the expected low points will be some 10% higher. I would suggest that the shorter would be the sweeter for all concerned.
Folks, we may still have way to go.
By Glenn Thorpe
© 2009 Copyright Glenn Thorpe - All Rights Reserved
Disclaimer: The above is a matter of opinion provided for general information purposes only and is not intended as investment advice. Information and analysis above are derived from sources and utilising methods believed to be reliable, but we cannot accept responsibility for any losses you may incur as a result of this analysis. Individuals should consult with their personal financial advisors.
© 2005-2022 http://www.MarketOracle.co.uk - The Market Oracle is a FREE Daily Financial Markets Analysis & Forecasting online publication.


