


Neutral Stock Market Sentiment Indicator
Stock-Markets / Stock Market Sentiment Mar 29, 2009 - 06:16 AM GMTBy: Guy_Lerner

 This is the second week in a row that investor sentiment is neutral. While there is nothing unusual about this, there are two scenarios that will likely play out over the next 3 to 4 weeks. In scenario #1, the market and current intermediate term price cycle will top out when there is extreme bullish sentiment (i.e., bear signal). To attract more bulls the equity markets will need to be trading meaningfully higher. In scenario #2, the rally will likely churn along for the next four to six weeks before rolling over. In this case, dips will be bought by those late to the party; marginal new highs may be seen, but in the end, the rally will fizzle and it will be tough to make money.
The "Dumb Money" indicator is shown in figure 1, and it is in the neutral zone. The "dumb money" looks for extremes in the data from 4 different groups of investors who historically have been wrong on the market: 1) Investor Intelligence; 2) Market Vane; 3) American Association of Individual Investors; and 4) the put call ratio.
Figure 1. "Dumb Money"/ weekly
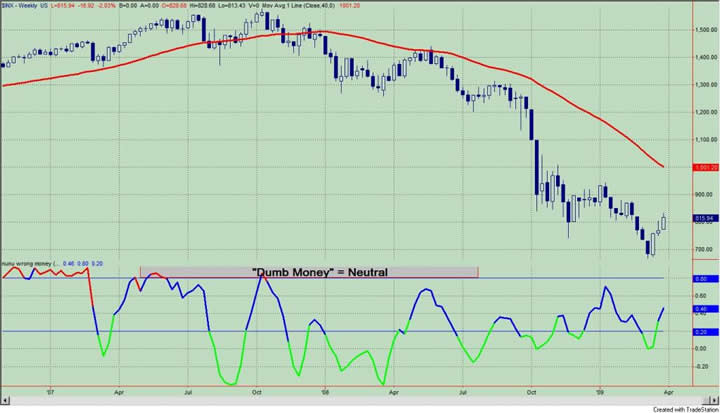
If the "Dumb Money" indicator remains neutral for 4 - 5 weeks while prices remain under their 40 week moving average, then there is a high likelihood that the market will rollover. I discussed these observations in the article, "Investor Sentiment: Some Context". Whether we roll over or push higher by the end of April is difficult to tell from this point, but I think it is very likely that lower prices should bring out the dip buyers and those still on the sidelines looking to get long because they missed their opportunity three weeks ago. In several weeks time, we will either be "selling strength" (i.e., hope) or riding the crest of a very bullish wave.
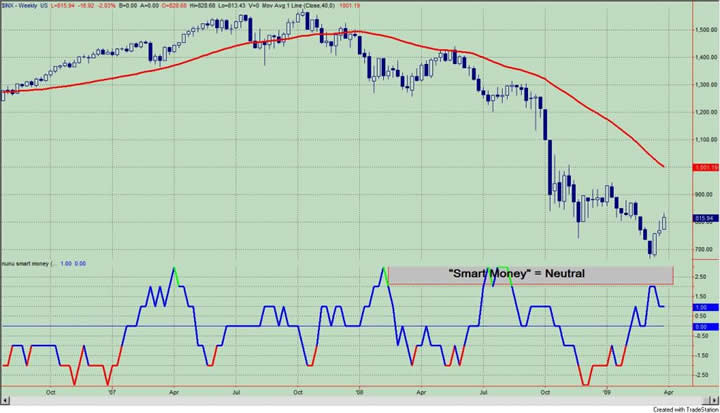
For completeness sake, I have included the "Smart Money" indicator in figure 2. The "smart money" indicator is a composite of the following data: 1) public to specialist short ratio; 2) specialist short to total short ratio; 3) SP100 option traders.
Figure 2. "Smart Money"/ weekly
By Guy Lerner
http://thetechnicaltakedotcom.blogspot.com/
Guy M. Lerner, MD is the founder of ARL Advisers, LLC and managing partner of ARL Investment Partners, L.P. Dr. Lerner utilizes a research driven approach to determine those factors which lead to sustainable moves in the markets. He has developed many proprietary tools and trading models in his quest to outperform. Over the past four years, Lerner has shared his innovative approach with the readers of RealMoney.com and TheStreet.com as a featured columnist. He has been a regular guest on the Money Man Radio Show, DEX-TV, routinely published in the some of the most widely-read financial publications and has been a marquee speaker at financial seminars around the world.
© 2009 Copyright Guy Lerner - All Rights Reserved
Disclaimer: The above is a matter of opinion provided for general information purposes only and is not intended as investment advice. Information and analysis above are derived from sources and utilising methods believed to be reliable, but we cannot accept responsibility for any losses you may incur as a result of this analysis. Individuals should consult with their personal financial advisors.
Guy Lerner Archive |
© 2005-2022 http://www.MarketOracle.co.uk - The Market Oracle is a FREE Daily Financial Markets Analysis & Forecasting online publication.