


Stock Market Bottom Hopeful Signs- NOT!
Stock-Markets / Stocks Bear Market Mar 27, 2009 - 11:24 AM GMT

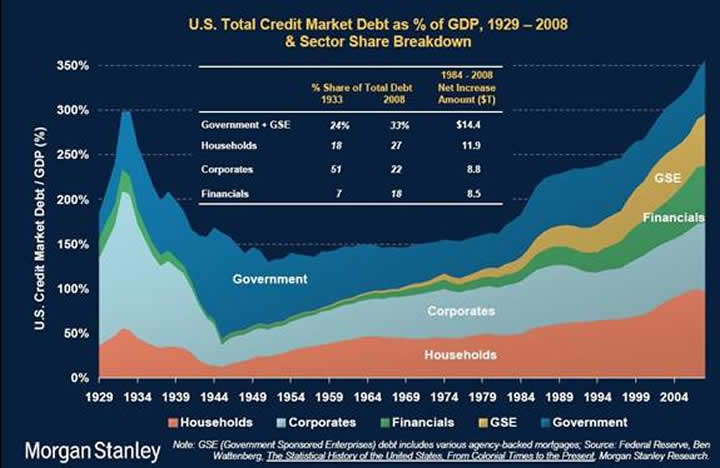
 Although long-time Market Oracle visitors are likely familiar with the GAMCO Mathers and Ned Davis Research versions of the graph, Morgan Stanley has put together a more comprehensive and colorfully up-to-date rendition of the now (in)famous chart of total U.S. debt as a percentage of gross domestic product. As you can see, not much has changed over the past two years as far as our precarious financial condition is concerned. (Hat tip to Infectious Greed .)
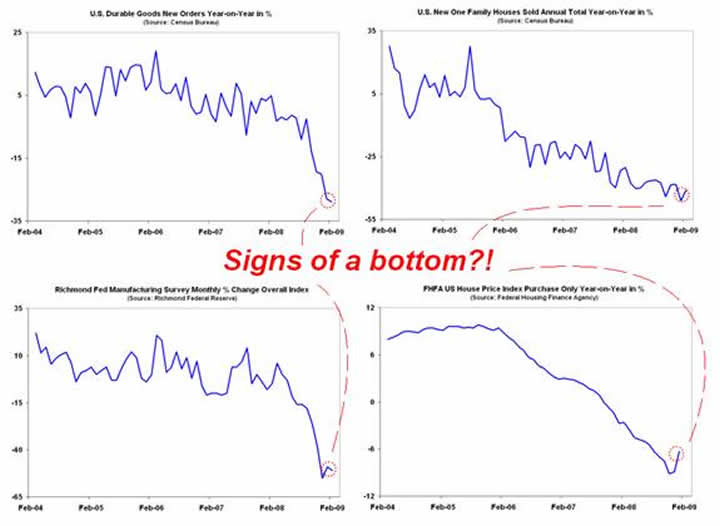
This week brought forth a slew of economic statistics, with many reported data points beating Wall Street's consensus estimates. That was enough to trigger calls from a number of mainstream economists that the economy had found a “bottom.” I don't know what these so-called experts were looking at, but based on the following charts -- of durable goods orders, new single family home sales, Richmond Fed district manufacturing activity, and home prices -- their optimism seems somewhat unfounded.
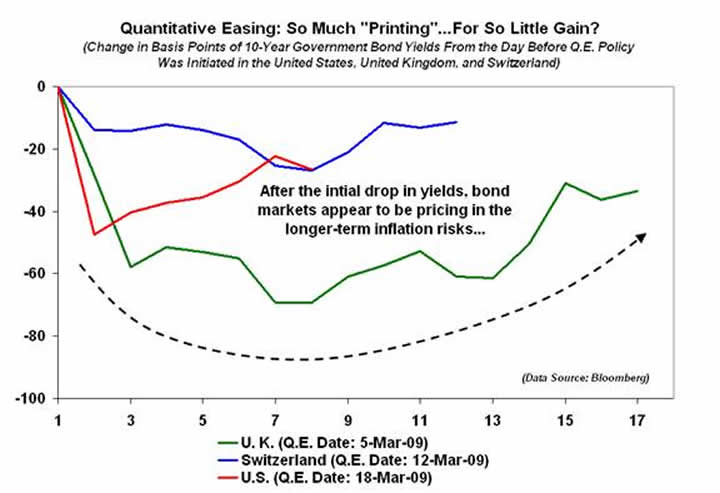
Over the past several weeks, three central banks -- the Swiss National Bank, the Bank of England, and the Federal Reserve -- decided that they were not having much luck with traditional policy measures and initiated what some have called the “nuclear option”: quantitative easing (otherwise known as cranking up the printing presses). The hope was that by buying mainly longer-dated bonds with money created out of thin air, authorities could unlock frozen credit markets and drive down the cost of borrowing. Unfortunately, while the initial reaction to the announcement from each central bank was not unexpected, longer-term interest rates have since crept higher in all three cases, suggesting that investors are worried about the inflationary consequences of “policymakers gone wild.”
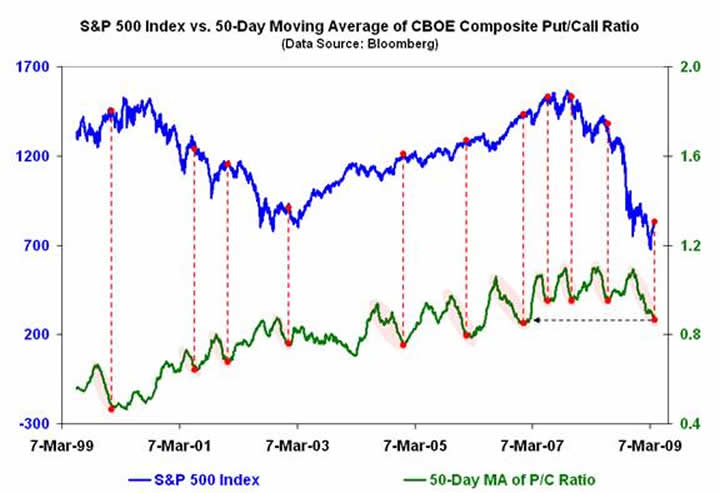
Finally, while no technical indicator is infallible, a quick read of the chart of the 50-day moving average of the CBOE's composite put/call index (CPCI) vs. the S&P 500 suggests that when the CPCI experiences a ski slope-like decline over the course of several months, it often signals that a near term correction -- or worse -- will soon be at hand. Given what has been happening with this particular indicator lately, that may mean the oversold bounce from the early-March lows is poised to run out of steam.
By Michael J. Panzner
http:/www.financialarmageddon.com
Copyright © 2009 Michael J. Panzner - All Rights Reserved.
Michael J. Panzner is the author of Financial Armageddon: Protecting Your Future from Four Impending Catastrophes and The New Laws of the Stock Market Jungle: An Insider's Guide to Successful Investing in a Changing World , and is a 25-year veteran of the global stock, bond, and currency markets. He has worked in New York and London for HSBC, Soros Funds, ABN Amro, Dresdner Bank, and J.P. Morgan Chase. He is also a New York Institute of Finance faculty member and a graduate of Columbia University.
Michael J. Panzner Archive |
© 2005-2022 http://www.MarketOracle.co.uk - The Market Oracle is a FREE Daily Financial Markets Analysis & Forecasting online publication.